





Analyzing the Federal Fleet: Unveiling Key Data and Trends from Fiscal Year 2022
As part of the 2023 Industry Handbook, Government Fleet also looked at data from the U.S. General Services Administration’s FY-2022 Federal Fleet Report.
November 15, 2023
2 min to read
ABOUT THE DATA: Data on this and the following page is derived from the U.S. General Services Administration’s FY-2022 Federal Fleet Report. The data comes from the Federal Automotive Statistical Tool (FAST) as reported by agencies.
Federal Vehicles, Inventory, and Acquisition
The federal fleet grew by nearly 2% in fiscal year 2020 with a reported inventory total of 657,506. However, between 2021 and 2022 there was a slight dropoff with inventory totals going from 656,724 to 656,494.
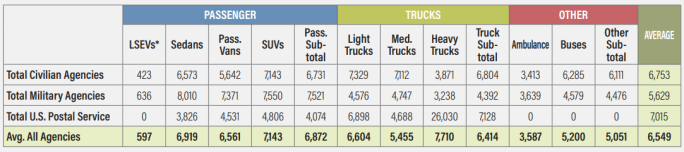
This table shows the average miles traveled per vehicle in fiscal year2022.
When looking at total fleet composition by fuel type as well as acquisitions, gasoline was at the top of the list with an inventory of 371,404 and an acquisition of 25,121. E85 (or flex fuel) had the second-highest inventory and acquisition at 166,929 and 7,166, respectively. These were followed by diesel and gasoline hybrid. Electric had an inventory of 2,141 and an acquisition of 53.
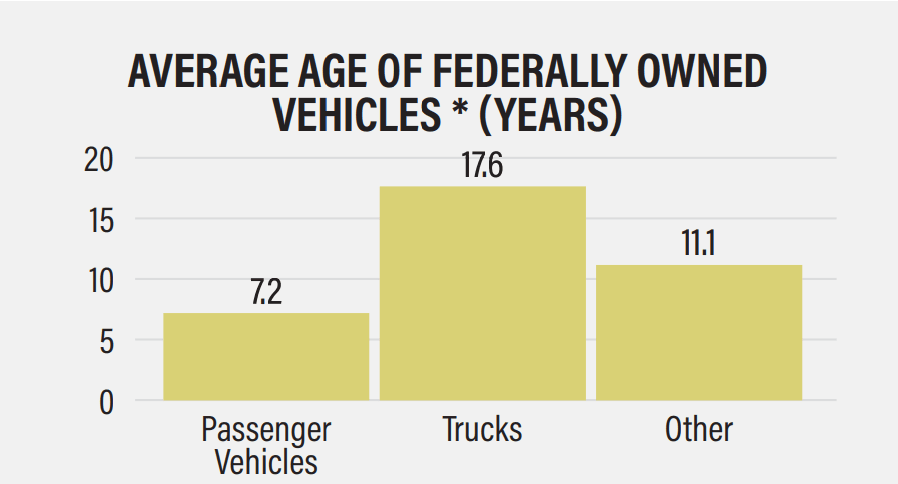
The average age of federally owned vehicles (these are agency-owned vehicles only, not commercially leased or GSA Fleet vehicle) was just over 17 years for trucks with passenger vehicles having 7.2 years and 11.1 years for other vehicle types.
Federal Cost-Per-Mile and Average Miles Per Vehicle
The cost-per-mile for all vehicle types in the federal fleet has increased over the previous year. Cost-per-mile for trucks was at $1.32, with passenger vehicles at $.80, and $3.72 for other vehicles.
Federal fleets saw an average of 6,549 miles-per-vehicle with the U.S. Postal Service having the highest average at 7,015 followed by civilian agencies at 6,753 and military agencies at 5,629.
For civilian agencies, light trucks had the most miles at 7,329; military agencies’ SUVs had the most miles driven at 7,550 miles; the U.S. Postal Service topped the list with heavy trucks being driven the most at 26,030 miles driven. Low-speed electric vehicles had the least amount of miles driven across all three agencies.
Subscribe to Our Newsletter
More Operations
Is Keeping Older Fleet Vehicles Really Saving Money?
Is keeping vehicles longer saving money, and what happens when a diagnostic test points to the wrong fix?
Read More →
How Smart Fleet Strategy Can Help Local Government Agencies Do More with Less
Keeping a vehicle longer may ease this year’s budget, but what does it cost the next one? A closer look at fleet decisions can reveal opportunities to reduce spending while protecting essential services.
Read More →
Connect with Government Fleet on LinkedIn
From industry news and fleet management strategies to conversations with peers, Government Fleet's LinkedIn page offers public-sector fleet professionals another way to stay informed and connected.
Read More →
Town of Queen Creek Named Most Successful Fleet Award Winner of Inaugural RTA Fleet Success Awards
Five fleets were honored at RTA Connect 2026 in Chicago for excellence across resource efficiency, intentional culture, risk management, and stakeholder satisfaction.
Read More →
Sponsored•October 14, 2026
A buyer's guide to fleet management software in 2027
Buying fleet management software in 2027 means looking beyond features and price. As fleet operations, technology and expectations evolve, this guide explores what today’s fleet professionals should consider when choosing a system that can deliver value now and adapt to what comes next.
Read More →
Hazard Alerts, Fleet Car Sales Rise and a New Shuttle Concept
Fleet car sales doubled, but the bigger picture tells a different story in this week’s roundup.
Read More →
How St. Johns County Turned Fleet Data Into Better Replacement Decisions
St. Johns County, Florida, had fleet data, but turning it into reliable decision guidance was another matter. Instead of starting over with a new fleet management system, the county connected existing tools and built a scoring system that gives managers an objective look at fleet health.
Read More →
Fleet Forward Conference Introduces One-Day Passes for 2026
New one-day registration lets fleet professionals attend Tuesday, Wednesday, or Thursday, with passes available for $249.
Read More →
ENC Unveils its ZAVIR Medium-Duty Shuttle
Two variants of the concept shuttles were revealed: a low-floor configuration and a high-floor configuration.
Read More →
Could Your Next Fleet Technician Start as an Intern?
What if your next technician hasn’t worked in a fleet shop yet? What fleets are doing to free up time.
Read More →