


Keep Reading: Top KPIs to Track to Improve Fleet Performance
14 Metrics Government Fleets Should Track
The metrics government fleets should track to get a full understanding of their fleet operation.
November 19, 2025

For government fleets, data is both a reflection of performance and a roadmap for progress.
Photo: Fleetio
7 min to read
Fleet data is fundamental for more than understanding efficiency and productivity; it can help fleet managers across departments standardize practices and advocate for needed resources. To meet these goals, there are a number of metrics government fleets should track to get a full understanding of their fleet operation.
And these metrics aren’t just siloed numbers, rather, they work together to give fleets insight into total cost of ownership by asset, total fleet operating costs, productivity, asset usage, cost inflation causation, and more.
Breaking Down the Metrics
1. PM On-Time Completion Rate
Preventive maintenance is one of the best ways to lengthen the lifespan of your assets and save on costly repairs, which ultimately increases uptime. Whether you perform maintenance in-house or outsource to a third party, monitoring the time assets spend in the shop ensures services are being completed on time. Implement a PM schedule and track completion rates to analyze all routine maintenance.
You can use digital fleet solutions, like a fleet optimization platform, to automatically collect additional data related to this metric and track each open work order and service task so you know what’s being done, what’s in progress, and what the estimated service duration is.
2. Time to Repair
Preventing downtime should always be front of mind for fleets. When assets are parked in the shop for an unnecessary length of time, there’s a problem. Track not only how long assets are in the shop but also the active time technicians spend on repairs. This helps you determine technician productivity so you can spot underperformers versus the need for additional techs — or the need to tap a third-party shop — due to workload volume.
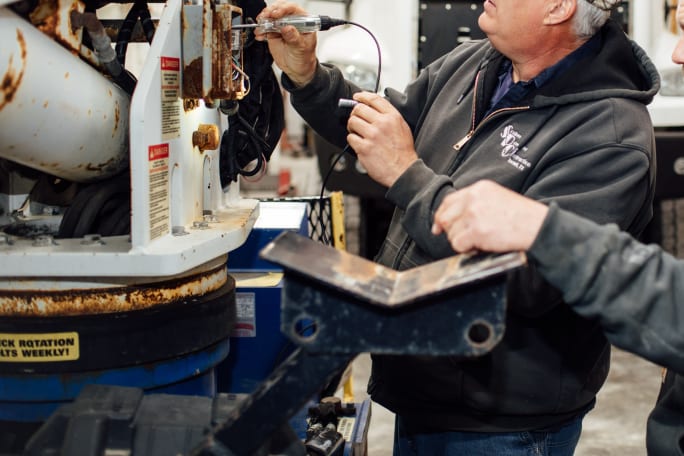
If you’re managing maintenance in-house, you need to have the right tools on hand to minimize asset downtime in the shop.
Photo: Fleetio
3. Scheduled vs Unscheduled Service
Low inspection compliance rates, low PM compliance rates, ineffective PM schedules, harsh driving, and running an asset past its useful life are all factors that can lead to an increase in unscheduled services. According to a 2025 benchmarking report, fleets average about 55% scheduled vs about 39% unscheduled service rates, but a 70/30 split is the goal to shoot for. Measuring unscheduled services against planned services can help you determine if there’s an issue so you can dig deeper to find the cause.
4. Inspection Completion Rate
Inspections keep fleets compliant and alert managers of asset issues while providing insights into asset health. With paper inspections, pencil-whipping can be a problem and distort your data, not to mention cause missed issues. Digital inspections improve completion rates and audit readiness. Tracking your inspection completion rate can help ensure drivers stay on top of inspections and that you collect vital data touchpoints for each asset.
5. Inspection Pass/Fail Rate
Completing inspections is one thing, but you should also pay attention to the results to understand the overall effect of your maintenance plans. When assets continually pass inspections but end up in the shop, it could point to an under-thorough inspection process. On the other hand, an asset that is constantly failing inspections could indicate that it has outlived its usefulness in your fleet.
6. Downtime vs. Uptime
In relation to scheduled and unscheduled maintenance, the downtime and uptime on each of your assets is essentially the consequence of maintenance, and tracking it can help you determine whether or not you’re still getting a positive ROI. If an asset is spending more time in the shop than out on the road, it could be a good indication that it may be time to replace it.

Investing in a fleet isn’t cheap, especially when it comes to specialized vehicles, so getting the most out of your assets is essential.
Photo: Fleetio
7. Mileage/Hours
Your odometer is the key to unlocking tons of fleet insights, from PM scheduling to determining optimal asset replacement windows. Tracking odometer readings ensures you stay prepared and proactive for maintenance milestones and replacement timelines. As most PM tasks are based on mileage and hour intervals, receiving regular odometer updates allows you to keep your assets in top condition.
8. Fuel Consumption and MPG
Fuel is one of the largest ongoing fleet expenses, so it’s crucial to closely track usage and spend. Monitoring and calculating fuel costs and consumption in real time can benefit your fuel management process, and this can be easily handled via digital fleet solutions. Having a way to gauge fuel consumption regardless of your method is important to ensuring your assets are running properly and maximizing ROI with their fuel expenditure.
9. Utilization rate
Investing in a fleet isn’t cheap, especially when it comes to specialized vehicles, so getting the most out of your assets is essential. Monitoring your fleet assets will help increase your ROI and maximize their lifespan. Tracking average hours of use or miles per day not only keeps you on time with preventive maintenance scheduling, it also helps you maintain a sustainable fleet size and reallocate assets to other departments if and as needed.
10. Operational Life
Asset replacement can be a daunting task, and for government fleets working within a strict budget, an asset that’s permanently out of commission before expected may not be replaced until the next fiscal year. Add the current extended lead times for new vehicles, and you could be down an asset for 2+ years or more. Approach each asset’s operational life estimate strategically based on historical lifecycle and performance data, and give some wiggle room for unexpected obstacles.
11. Total Cost of Ownership
Perhaps the most important and comprehensive metric you should be tracking is your fleet’s true TCO. This is one of the most challenging aspects to track and manage, but knowing your fleet’s TCO allows you to confidently make data-driven decisions.
Getting a breakdown of your fleet expenses gives you an understanding of your ROI and can help you determine strategies for PM and asset replacement. TCO can also show you which assets are underperforming and eating up the budget, providing numeric proof you can take to stakeholders to show the need for additional resources.
12. Cost per Mile
Cost per mile (CPM) is a metric that calculates the costs associated with operating assets over a specific distance, typically to the degree of a single mile. Fleet managers rely on CPM as a performance indicator to monitor and manage the efficiency and cost-effectiveness of their fleet operations; if CPM increases, then an asset might no longer be as efficient as it should be or may not be providing the same value as it was before.
This metric provides valuable insights for budgeting and financial forecasting, as well, allowing for more effective resource allocation.

While these key metrics are important to track, there is another aspect to consider: standardization across fleet locations.
Photo: Fleetio
13. Parts and Inventory Value
If you’re managing maintenance in-house, you need to have the right tools on hand to minimize asset downtime in the shop. Tracking your parts inventory helps avoid stockouts and reduces unnecessary inventory costs. Parts make up over one-third of asset maintenance costs, making controlling inventory levels an important component for both uptime and the budget.
Keeping track of part quantities in an online parts database provides insight into part usage, and regularly viewing part order history and tracking inventory values helps you make actionable decisions on future spending.
14. Average Miles per Driver
While fleet managers focus heavily on assets, it’s also important to track and manage those using them. Digital fleet solutions provide several ways to track driver behavior and safety. Assigning assets to drivers allows you to quickly view the duration and distance of assignments and keep your drivers accountable.
Integrating other systems like telematics and fuel cards into a fleet tracking app allows you to further track driver productivity by getting a comprehensive view of their location, habits, and spending.
Standardizing Metrics Matters
While these key metrics are important to track, another aspect to consider is standardization across fleet locations. For managers overseeing multiple departments or fleets spread across a given area, standardization is key to creating consistency and transparency in operations.
Without a unified framework, each department may collect and interpret data differently, leading to fragmented insights that make it difficult to assess performance at scale. Standardization clarifies how efficiently each department operates, enabling meaningful comparisons and helping leaders pinpoint inefficiencies and establish best practices.
Beyond improving internal alignment, standardized metrics empower government fleets to advocate for resources and policy improvements more effectively. When fleet data is consistent across departments, it becomes a powerful communication tool that demonstrates measurable needs and progress to stakeholders.
Turning Metrics into Momentum
For government fleets, data is both a reflection of performance and a roadmap for progress. Tracking these key metrics empowers fleets to identify inefficiencies and enables them to build a sound strategy to correct issues and improve fleet operations, including building a unified standard of operation across departments and locations.
Standardized data also equips fleets with the leverage to advocate for what they need most, including additional technicians, better tools, upgraded assets, and digital fleet solutions. The metrics provide tangible proof that drives funding approvals and resource allocation while helping government fleets move beyond simply maintaining operations to actively improving them.
Subscribe to Our Newsletter
More Blog Posts
Why Technician Development Is a Retention Strategy
Clear development opportunities can help fleets show technicians how their skills and careers may progress within the organization.
Read More →
The Missing Link in Fleet Safety: Turning Data into Behaviour Change
Every municipal vehicle tells residents something about how their fleet is being managed. For King Township, Ontario, that visibility made speeding more than a driver performance issue.
Read More →
Building a Cross-Department Fleet Data Standard: What to Agree on First
As municipalities expand their use of fleet technology, the challenge is less about collecting data and more about making that data usable.
Read More →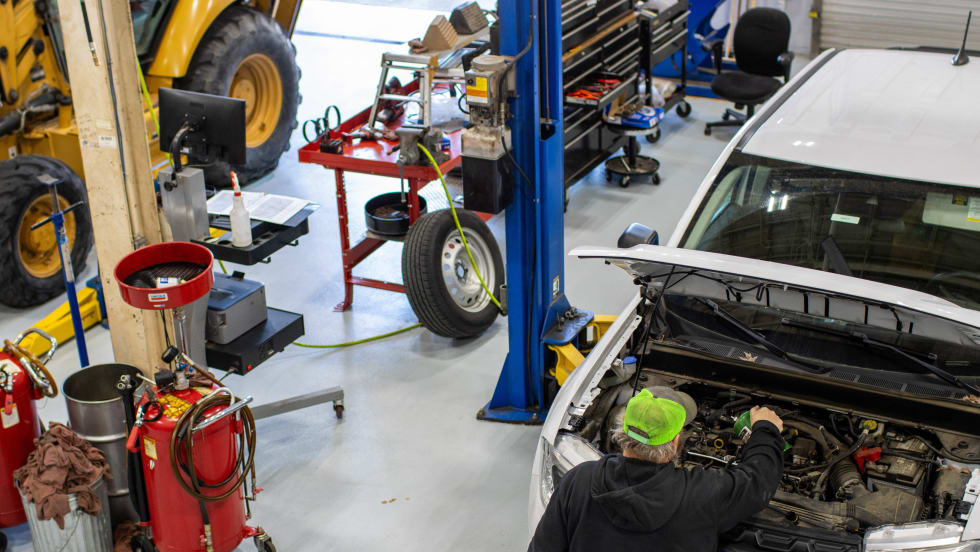
7 Tips for Smarter Fleet Management
The potential to manage your fleet effectively while ensuring the safety of both employees and the community can often go untapped, but there are certain habits you can adopt to get to that point.
Read More →
Why Now Is the Time to Return to Government Fleet Expo
For fleet professionals who haven't attended GFX in a while, this year's event provides more than just education sessions and networking opportunities. From emerging leaders and innovative fleet strategies to industry recognition and peer-to-peer discussions, GFX 2026 reflects the changing landscape of public fleet operations.
Read More →
What to Expect at GFX
The Government Fleet Expo & Conference can be overwhelming in the best way possible. Whether you’re a first-time attendee or a returning fleet professional, these practical tips will help you plan ahead, stay energized, maximize networking opportunities, and make the most of every moment at GFX 2026 in Long Beach.
Read More →
How to Get the Most From an Industry Conference
A new strategy in how to present conference attendance justification for you and even for your staff and how you and they can benefit and even thrive in the conference environment.
Read More →
How Electric Vehicles as a Service Could Reshape Public Fleets
How the EV model can address concerns about meeting state mandates, cost, emissions and range anxiety.
Read More →
Pick One: Hire a Technician or a Data Analyst
Short on techs and drowning in data, which single hire moves your fleet farther—a technician or a data analyst—and how does AI change the calculus?
Read More →
Why Refuse Truck Tech Must Serve the Operator
Ride along on a pre-dawn refuse route to see how operator-first, integrated safety technology turns split-second risk into preventable events and why purpose-built trucks are the next step in fleet safety.
Read More →