

Related: Samsara Launches Integrated Fleet Management Solution for Ford Vehicles
Samsara Data Shows Risky Behavior Peaks at Start, End of Shifts
Here's how fleet managers can use this data to coach drivers more effectively.
by Ali Akhtar
August 6, 2020
7 min to read

Driver safety is more important than ever. Although the nation’s roadways may be emptier due to COVID-19, multiple reports have shown they are not necessarily safer—and may even be more dangerous. In fact, a recent Samsara analysis found less congested roads have resulted in a 20% increase in severe speeding among U.S. commercial drivers.
To help fleet managers better understand patterns in risky driving behavior, Samsara wanted to know: How does driver behavior change over the course of a shift? When are drivers most likely to exhibit risky behaviors?
And how can fleet managers use this data to coach drivers more effectively?
Samsara took a sample of some of their most frequently observed unsafe driving behaviors—including two measured by g-force (harsh acceleration and harsh braking) and two detected using artificial intelligence (distracted driving and tailgating). The sample Samsara analyzed contained more than two million of these high-risk behaviors that have occurred across their U.S. commercial fleet customers since January 1, 2020. In order to understand unsafe driving patterns, Samsara looked at the frequency of incidents over the course of a driver’s shift.
Here are their key findings:
● Harsh acceleration, harsh braking, distracted driving, and tailgating occur more frequently at the beginning and end of drivers’ shifts.Samsara found these risky driving behaviors are 26% more likely to occur in the first tenth of a shift than the middle of the shift. In the last tenth of a shift, they are 41% more likely to occur.
● There is no one factor responsible for this trend. The data shows there could be multiple factors leading to these risky driving behaviors, including increased traffic and distractions in cities, last mile stops, and driver fatigue.
● It’s possible to adjust this behavior. The data shows when drivers receive in-cab alerts for harsh braking and harsh acceleration, the frequency of those behaviors is reduced by up to 40%.
Risky Driving Behaviors Occur More Frequently at The Beginning and End of Drivers’ Shifts
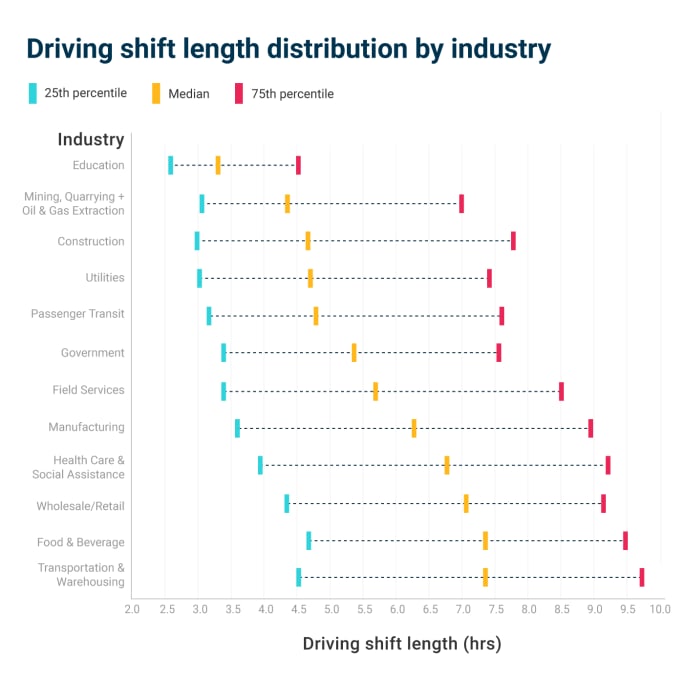
Photo: Samsara
When it comes to driver safety, there are certain patterns that are widely known. For example, the National Safety Council has found it’s more dangerous to drive at night. According to the National Highway Traffic Safety Administration, nearly 70% of all collisions in the U.S. occur within 10 miles of the driver’s home. But many commercial drivers work longer hours (and drive farther distances) than the average American driver.
How does this affect their behavior?
To answer this question, Samsara analyzed driver shifts across the Samsara platform since January 2020. According to the dataset, the average shift length is around seven hours, with some meaningful variations by industry. For example, drivers operating in the transportation and warehousing, food and beverage, and wholesale retail industries tend to have the longest shifts (exceeding seven hours), while those in the education, oil and gas, and utilities industries have shorter shifts (closer to four to six hours).
Despite the variation in shift length, the data shows a consistent trend across shifts. When Samsara looked at the sample of common unsafe driving behaviors, Samsara found they occur more frequently at the beginning and end of drivers’ shifts. Harsh acceleration, harsh braking, distracted driving, and tailgating are 26% more likely to occur in the first tenth of a shift than the middle of the shift. In the last tenth of a shift, they are 41% times more likely to occur.
The data shows this trend begins to appear when shifts reach about two hours and remains consistent for shifts as long as 12 hours. As shown in the chart below, whether you look at a two hour shift or a 10 hour shift, most of these unsafe driving behaviors occur at the beginning and end of the shift.
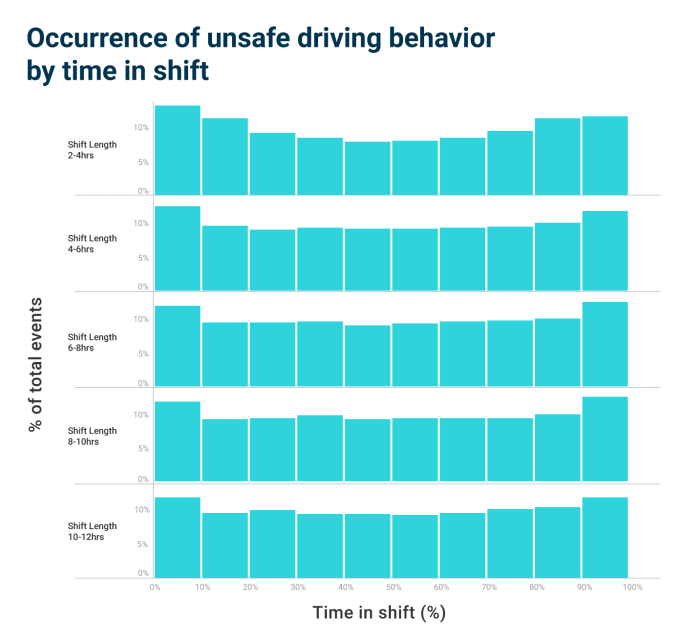
Photo: Samsara
Below is a breakdown of frequency by type of risky driving behavior. Harsh acceleration, for example, is an astounding 77% more likely to occur in the last tenth of a shift than anywhere in the middle. Tailgating, which is typically observed in highway driving settings (likely in the middle portion of a shift), is less susceptible to this effect. Still, tailgating behavior is 16% more likely to occur in the last tenth of a shift versus the middle.
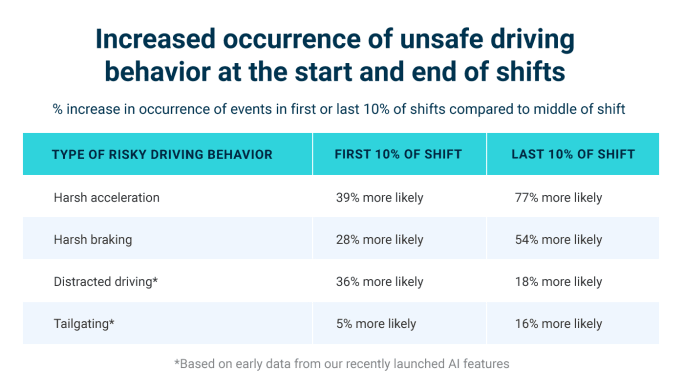
Photo: Samsara
There is No One Factor Responsible for This Trend
What’s causing these risky driving behaviors to peak at the beginning and end of drivers’ shifts? There could be multiple causes, including:
● Increased traffic in cities: In instances where shifts start on local roads and then move to highways, there could be more traffic and distractions at the beginning and end of a shift.
● Last mile stops: The data shows there are more short trips (likely due to deliveries and last mile stops) at the beginning and end of shifts, causing drivers to stop and start more frequently, which can create more opportunities for unsafe driving behavior.
● Driver fatigue: Drivers may be distracted or less alert at the beginning or end of shifts, especially when they are tired.
When Samsara controlled for each of these factors, Samsara saw a reduced effect—but didn’t see the trend go away. This leads one to believe each of these factors, and potentially others, contribute to the overall trend.
For example, to test how cities could affect this trend, Samsara isolated shifts that started or ended in top 40 U.S. cities and compared them to shifts that did not. Distracted driving was 26% more likely to occur near the end of a shift when that shift ended in a city vs. 17% when it did not—a significant change, but not enough to fully explain the effect.
Distracted Driving Occurs More Frequently at Start and End of Shifts In Cities
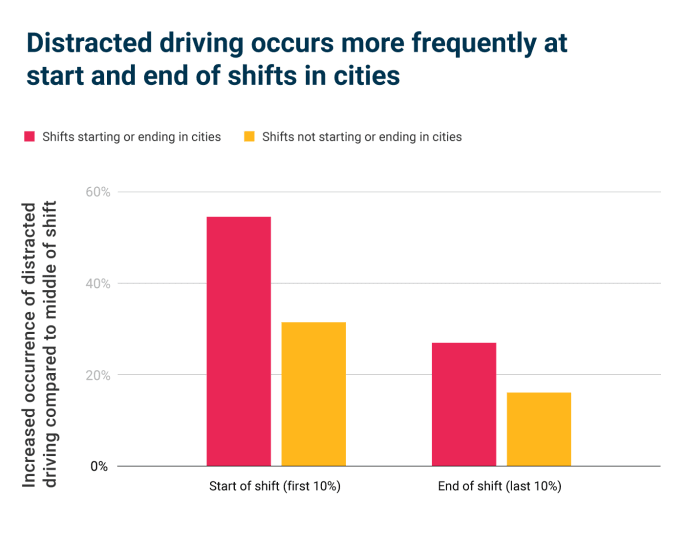
Photo: Samsara
In addition to cities and last mile stops, driver fatigue may also intuitively appear to be a factor in this trend. According to the Federal Motor Carrier Safety Administration, driver fatigue is a factor in roughly 13% of large truck accidents in the U.S. each year. While Samsara didn't control for driver fatigue in this analysis, they found the trend persists in shorter shifts (two to four hours in length), when drivers are less likely to be fatigued.
This leads one to believe that cities, last mile stops and deliveries, and driver fatigue all play a role in risky driving behavior peaking at the beginning and end of shifts—with no one factor being solely responsible.
Tips to Keep Your Drivers Safe
How can fleet managers put this data into action? Here are a few ways:
● Give drivers real-time feedback. Immediate feedback can help drivers adjust their behavior and reduce risk in real time. If you have dash cams with optional in-cab alerts, try turning them on. The data shows in-cab alerts related to harsh braking and harsh acceleration can reduce frequency of those behaviors by up to 40%, and Samsara expects this trend to persist for other types of in-cab alerts as well.
● Share these statistics with safety supervisors and drivers. Simply being aware of these trends can go a long way towards correcting unsafe driving behaviors. Consider sharing these findings in your next safety meeting or company newsletter.
● Include real footage in your coaching sessions. Research has shown people are 22% more likely to remember a fact when it is part of a story—and real dash cam footage is a powerful storytelling tool. If you have an example of harsh braking or distracted driving, share the footage with your drivers during coaching sessions. This is often more memorable and effective than coaching with a generic training video. Make sure to share footage of positive driving examples, too. According to a Globoforce, 79% of employees work harder when they feel recognized.
Methodology
● Samsara analyzed Samsara driving data since January 1, 2020, and grouped all trips that occurred for the same vehicle in a continuous time window up to 12 hours long into a single shift. To validate this approach, Samsara also constructed a smaller but statistically significant sample where individual drivers were assigned to shifts by Samara customers. The same trends were observed in both samples.
● Samsara joined the trips data above with their safety events database for four of their safety events: harsh acceleration, harsh braking, distracted driving, and tailgating. Data was joined by vehicle based on whether a safety event occurred in the same time window as a shift.
● To calculate the frequency of safety behaviors over the course of a shift, Samsara divided the shifts into buckets of 10% (i.e., first decile, second decile, etc). Samsara averaged the occurrence of safety events in the middle eight buckets and compared this to the first and last decile bucket to get the relative occurrence of harsh events occurring at the start and end of a shift.
● Samsara controlled for noise in the data by removing safety events occurring at very low speeds and false positives as flagged by customers or their algorithms to filter out noise.
● To control for the effect of shifts starting or ending in cities, Samsara used the Census Bureau’s cities dataset to identify the top 40 U.S. cities by population. Samsara then created another sample excluding shifts starting or ending in these cities and compared the relative occurrence of events for this sample vs. the overall population.
More Safety
Sponsored•July 17, 2026
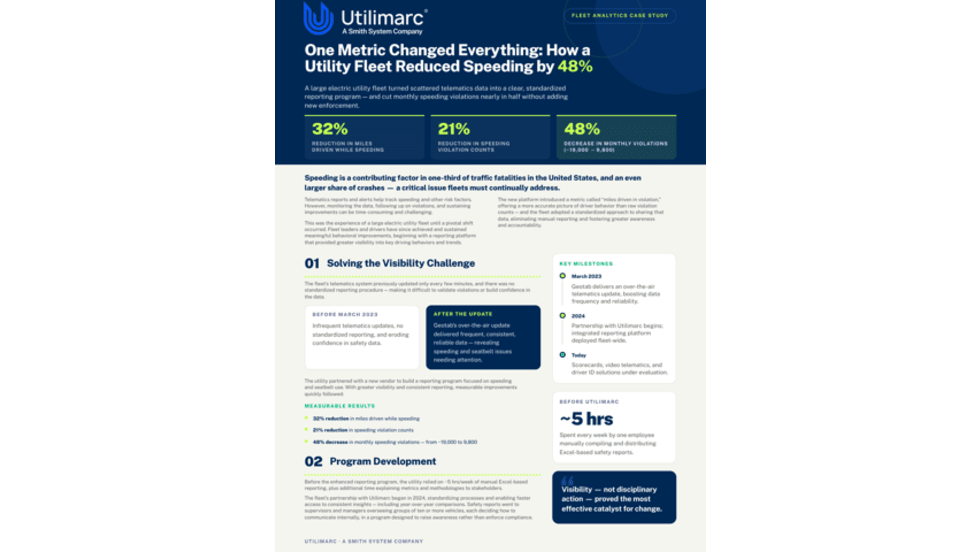
How Better Visibility Cut Speeding Violations by 48%
Fleet leaders don't need more data, they need clearer visibility into what the data is saying. This case study explores how one utility replaced speeding-event counts with a single metric — miles driven in violation — to strengthen safety and significantly reduce speeding violations.
Read More →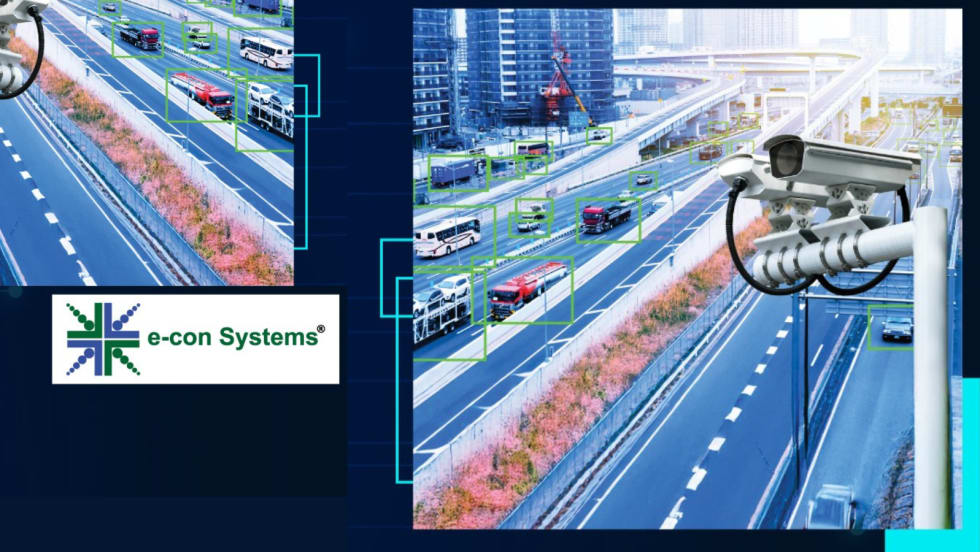
e-con Systems Expands AI Camera Tools for Traffic Monitoring
The systems support license plate recognition, traffic analytics, and video management for transportation agencies.
Read More →
King Township Pilot Links Driver Feedback to Reduced Speeding
How King Township, a best-in-class municipal fleet, reduced speeding by 10.9% and demonstrated a projected 349% ROI by putting safety ownership directly in drivers' hands.
Read More →
Beyond the Fireline: The Critical Role of Public Fleets in Wildfire Response
Behind every wildfire response is a complex network of vehicles, data, and decisions that must work in sync under extreme pressure. Global heating trends require strong fleet coordination and reliable communications to keep crews safe and operations running smoothly.
Read More →
How AI Is Transforming Public Fleet Safety - Part 1
AI-powered safety systems are helping public fleets tackle distracted driving by delivering real-time coaching and measurable behavior change behind the wheel. In part one of our Q&A, Nauto CEO Stefan Heck explains how agencies can improve safety, reduce costs, and navigate implementation challenges with AI-driven technology.
Read More →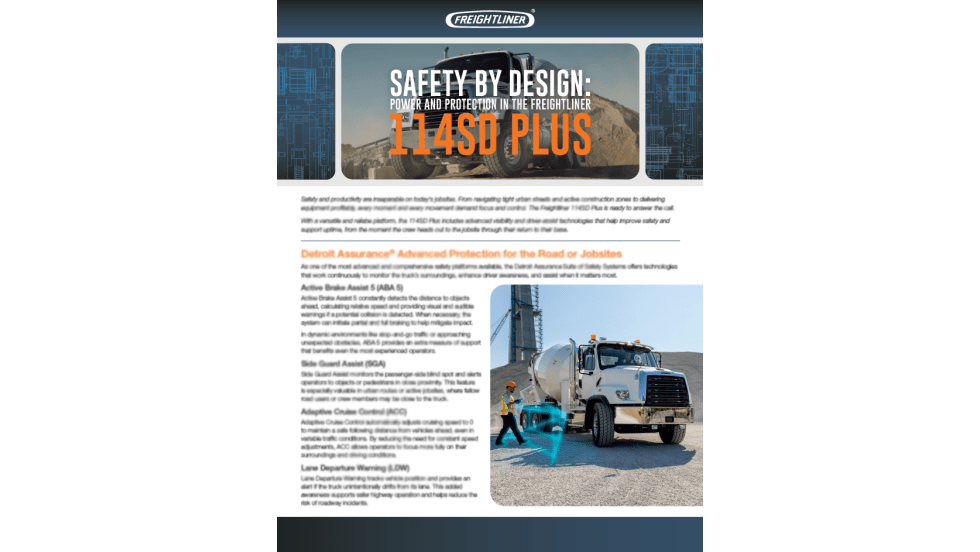
Sponsored•March 26, 2026
Reducing Risk and Improving Safety in Public Sector Fleets with Advanced Driver-Assist Technology
Public sector fleets face increasing pressure to improve safety, reduce liability, and operate efficiently. See how advanced vehicle technologies are helping agencies protect drivers, the public, and their budgets.
Read More →
3 Ways Fleet Tech Builds Public Trust
Managing a state or local fleet comes with levels of accountability private companies don’t have. Read how modern fleet technology helps elevate visibility and safety to strengthen community trust.
Read More →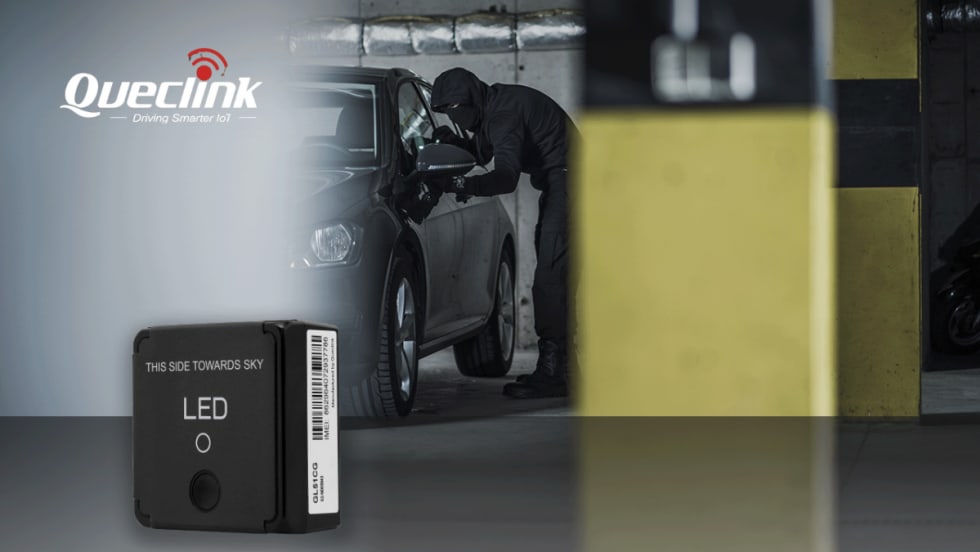
Tracker Innovation From Queclink to Boost Stolen Vehicle Recovery Performance
Queclink has introduced a backup telematics device designed to support stolen vehicle recovery by activating only when a primary tracker is disabled, helping fleets and financing providers respond more quickly to theft.
Read More →
First Response Fleets: 10 Takeaways for 2026
A practical look at what first response fleet leaders can apply right now, with clear guidance for making stronger decisions throughout 2026.
Read More →
Holiday Travel Surge: What Government Fleet Managers Need to Know About Increased Road Risks
As year-end travel reaches record levels, fleet managers must anticipate increased road congestion and safety challenges for government vehicles and drivers.
Read More →