

Related: 2019 Fleet Inventory and Age
Understanding Fleet Age and Costs
Fleet managers can use data to compare costs and effectiveness of vehicles across class sizes to determine which vehicles’ lifecycles can be extended and what should be sold.
by Dennis Jaconi and Debra Wolfe
June 11, 2020
Data allows fleet professionals to compare costs and effectiveness against similar fleets, which can demonstrate areas for potential cost-savings in the event of a reduced budget.
Photo: Getty Images
4 min to read
It’s no surprise that the COVID-19 pandemic has shaken up nearly every industry on the planet. From transportation and the food supply chain, to tech and jigsaw puzzle sales, nothing has been left untouched. Unfortunately, this means many fleets worldwide are experiencing restrictions, especially in their budgets. Alongside cutting costs, preparation is necessary for reduced spending in the coming years. This type of preparation requires two primary steps: evaluating and planning.
Determining What to Keep and What to Sell
To evaluate a fleet’s specific needs, it’s helpful to understand data across the government fleet industry, not just that of one organization. This data allows fleet professionals to compare costs and effectiveness against similar fleets, which can demonstrate areas for potential cost-savings in the event of a reduced budget. In this article, we are using benchmarking data from Utilimarc and AssetWorks to explore two key areas fleets should evaluate — the age of vehicles and labor hours.
Fleet managers can use this data evaluation to plan for the future. They can determine potentially amplifiable cost savings by holding on to vehicles that have mildly aged or could also contemplate selling off older units that have high maintenance costs. These units may be underutilized or simply not worth their weight. Potential savings can come from no longer possessing these units or recouped capital through resale. With this foresight, fleet managers can feel confident in their preparation for the upcoming years of reduced capital and can utilize data to predict trends in future costs for their vehicles.
Evaluating Fleet Age and Costs
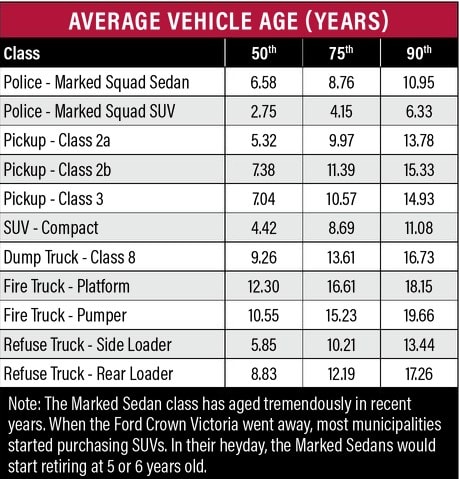
This table shows the average age of vehicles industry-wide. Comparing the age of fleet inventory versus industry averages can help fleet managers determine when their vehicles should be replaced.
Vehicle and equipment age are common areas of concern for fleet managers and operators. However, just because you have an older vehicle or piece of equipment doesn’t mean it makes financial sense to retire it. That being said, it can be helpful to understand how older equipment can be run efficiently and cost-effectively. When looking at benchmarked data on vehicle age from Utilimarc and AssetWorks, fleet organizations can compare their own vehicle ages to the industry standard.
In the data set “Average Vehicle Age (Years)” for top municipal classes below, the 50th percentile represents the average age of the vehicle type. The 75th percentile speaks for vehicles more advanced in age, which tend to see higher labor hours and less utilization. The 90th percentile then represents the oldest vehicles, which fleets typically keep as spares with low utilization rates.
Comparing inventory to these ranges can help fleet managers prioritize the vehicles that really are too old for proper use within their fleet.
The “Distribution of Industry Pickups” chart on the next page shows the number of pickups in the benchmark by age. The 50th, 75th, and 90th percentile can be useful statistics to understand the age of industry equipment.
By comparing vehicle data to these data sets from similar fleets (and doing some additional calculations), fleet organizations can get ahead of the game to determine which units are more costly than others. By eliminating and replacing only the proper vehicles, fleets can potentially find massive savings within their budgets.
Planning for More Labor with a Smaller Budget
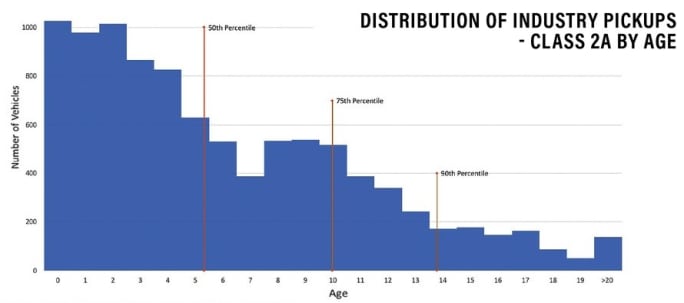
This chart provides more details on the age of Class 2A pickup trucks, showing ages in the 50th, 75th, and 90th percentile.
Older vehicles don’t just require more expensive parts. Fleet managers know this. Older vehicles also often require longer and more frequent repairs. This results in a higher demand for technicians to keep those vehicles running.
This demand can be satisfied by hiring more mechanics, working overtime, or using an outside vendor — but step one is determining how much additional labor they should anticipate. The table below shows the average incremental increase in labor hours per year that can be expected for a vehicle of each class.
If a fleet operation spent 120 labor hours on a side-loader refuse truck last year, 137 hours should be planned for this year. This is assuming their trucks run close to the industry average mileage.
However, note that these numbers are averages, and repairs on individual assets tend to be more sporadic than an average implies.
Use Data to Make Smart Decisions
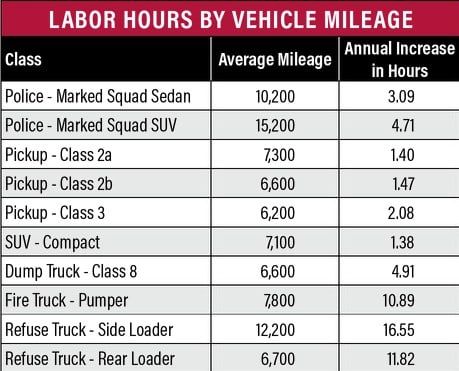
Older vehicles often require more labor hours. By looking at this data, a fleet manager may determine the cost of additional labor hours for each class of vehicle and decide whether it’s more cost-effective to replace these vehicles.
The COVID-19 pandemic has disrupted many industries from their typical status quo, including government fleets. In some cases, fleets that were expecting a bigger budget next fiscal year are being asked to make cuts where possible.
To gain a better understanding of their fleet’s makeup, and where costs can be cut, fleet managers must take stock of certain demographics. Vehicle age (and subsequently, increased labor hours) are two identifying factors that may help fleet managers determine where costs can be reduced. With a greater knowledge of the specifics of their fleets’ operating costs in these areas, a reduced budget can be incorporated directly into decisions regarding vehicle utilization, replacement, and maintenance — based on an age and average labor hour measurement.
About the Authors

Debra Wolfe

Dennis Jaconi
Dennis Jaconi is the director of marketing at Utilimarc, a fleet solutions, analytics, and telematics company. Debra Wolfe is the director of product strategy at AssetWorks, a fleet management information systems company. They can be reached at DJaconi@utilimarc.com and Debra.Wolfe@assetworks.com.
Subscribe to Our Newsletter
More Equipment
APEX by BendPak Launches AL9LC Two-Post Lift
The new low-ceiling floorplate car lift is designed to maximize overhead clearance for fleets.
Read More →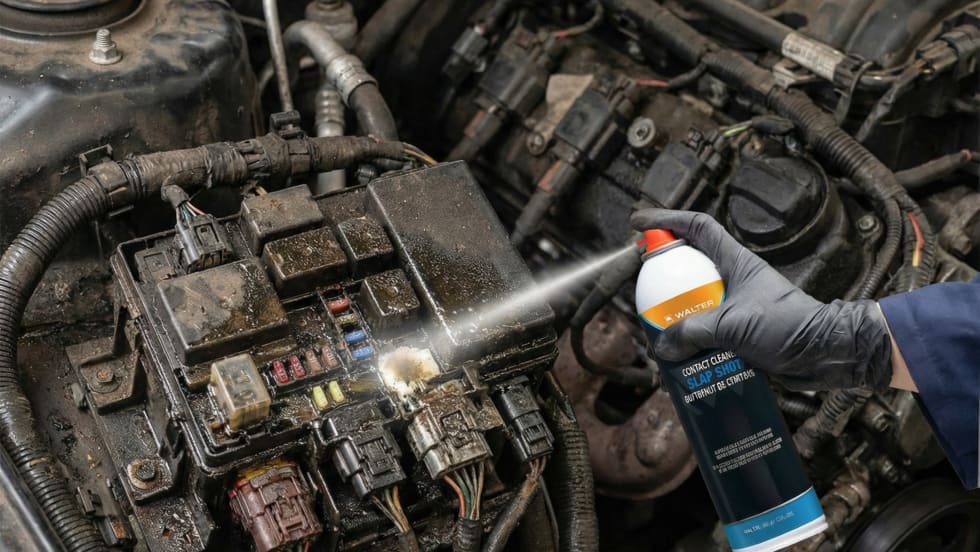
New Slap Shot Contact Cleaner: Heavy-Duty Cleaning Power Without the Residue
Slap Shot Contact Cleaner combines fast contaminant removal, rapid evaporation, moisture displacement, no-wipe cleaning, non-conductive performance, and residue-free cleaning into a single solution.
Read More →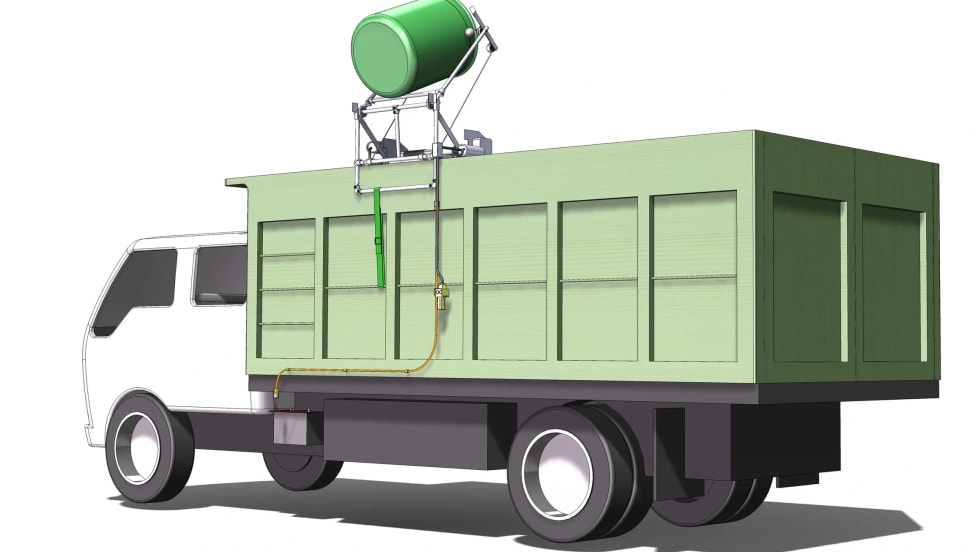
New Powered Carry Barrel Lift Helps Crews Dump Heavy Barrels Into Trucks With Less Manual Lifting
The Carry Barrel Lift is a new truck-mounted attachment designed to help landscape and municipal crews lift and dump heavy 60-gallon barrels more efficiently while reducing manual strain.
Read More →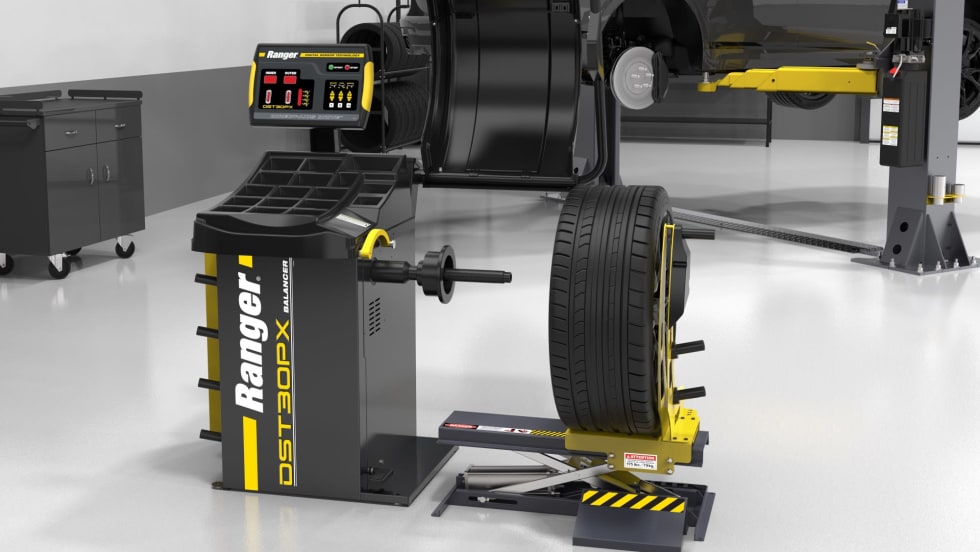
New Ranger RWL175 Universal Wheel Lift Delivers Faster, Safer Mounting on Most Wheel Balancers
Ranger’s new RWL175 Pneumatic Wheel Lift is designed to help technicians safely mount wheel assemblies up to 175 pounds while reducing strain and improving shop efficiency.
Read More →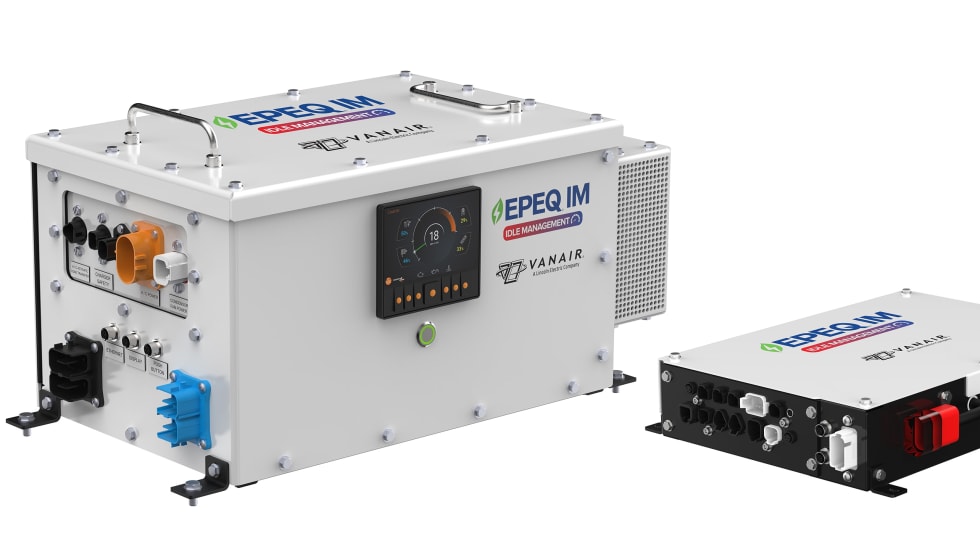
Vanair Introduces EPEQ IM HVAC System
Vanair introduced its EPEQ IM HVAC idle management system, designed to reduce engine idling, lower maintenance costs, and extend vehicle life through factory HVAC integration and automated climate control.
Read More →
Panasonic Connect Launches the TOUGHBOOK 56
Panasonic introduces the TOUGHBOOK 56, a rugged, modular laptop designed for public safety and field operations, featuring AI-ready processing, expanded connectivity, and enhanced security.
Read More →
Sonim XP5plus 5G Available on AT&T and FirstNet
Sonim’s XP5plus 5G rugged device is now available on AT&T and FirstNet, combining push-to-talk capabilities, LMR interoperability, and 5G connectivity for public safety and enterprise users.
Read More →
New BendPak Wheel Spotting Dish Simplifies Lifting and Parking
BendPak added a wheel spotting dish kit as standard on its two-post lifts, designed to improve vehicle positioning accuracy and reduce setup time in service bays.
Read More →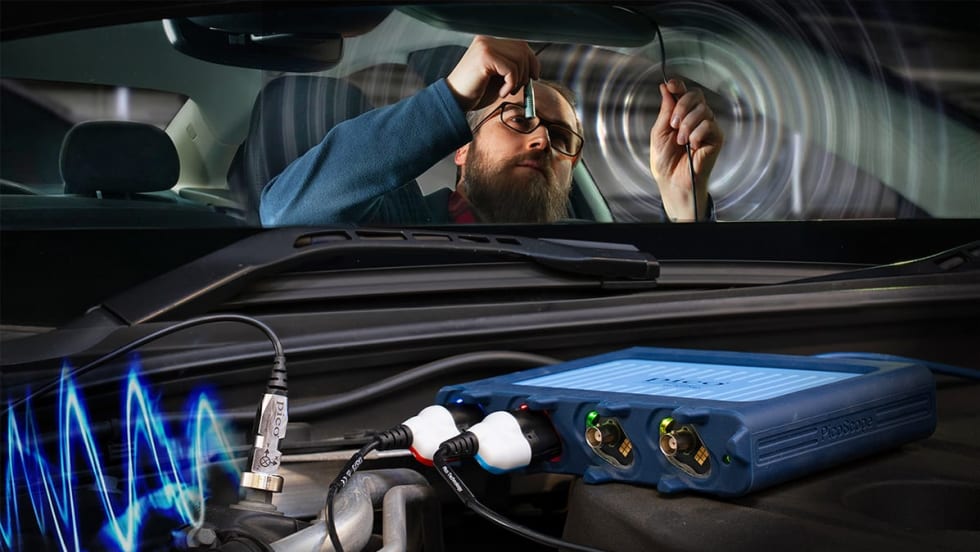
Pico Technology Introduces NVH Diagnostic Probes and Kits
Pico Technology introduced new NVH diagnostic probes and kits designed to streamline noise and vibration testing, enabling multi-axis data capture in a single test while reducing setup time and configuration errors.
Read More →
Tenhold Debuts Next-Generation Vehicle Systems for Law Enforcement and Public Safety
Tenhold launches a new line of vehicle mounting systems for first responders, including a firearm lock designed for durability and in-field security, with deployment across more than 25 states.
Read More →