Government Fleet Logo
MenuMENU
SearchSEARCH
Enter keywords to search across all content
A graph showing government fleet sales.
Newsby Nichole OsinskiJanuary 8, 2026

Government Fleet Sales End the Year on a Stronger Note

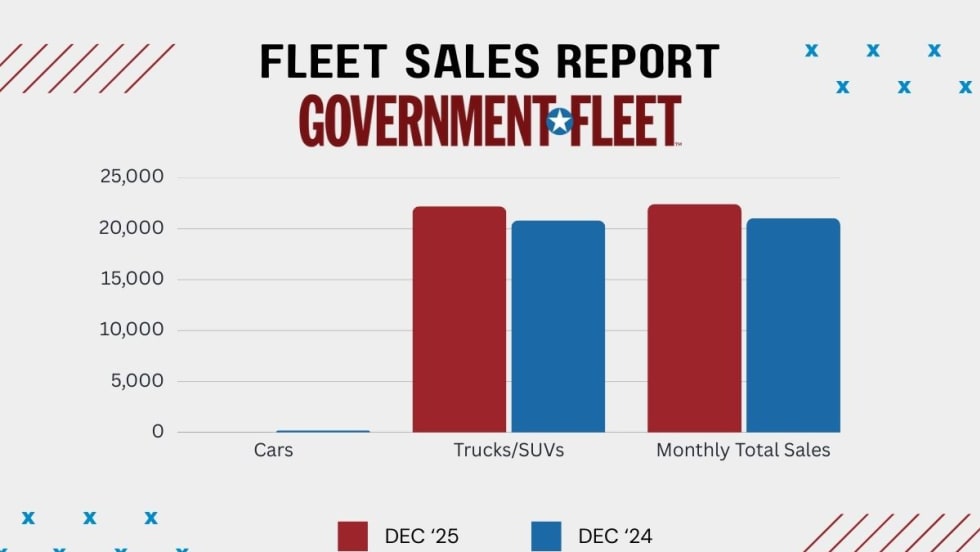
Government fleet vehicle sales were up 5.8% from 21,031 in December 2024.

Read More →
Newsby Nichole OsinskiNovember 4, 2025

October Government Vehicle Sales Down from 2024

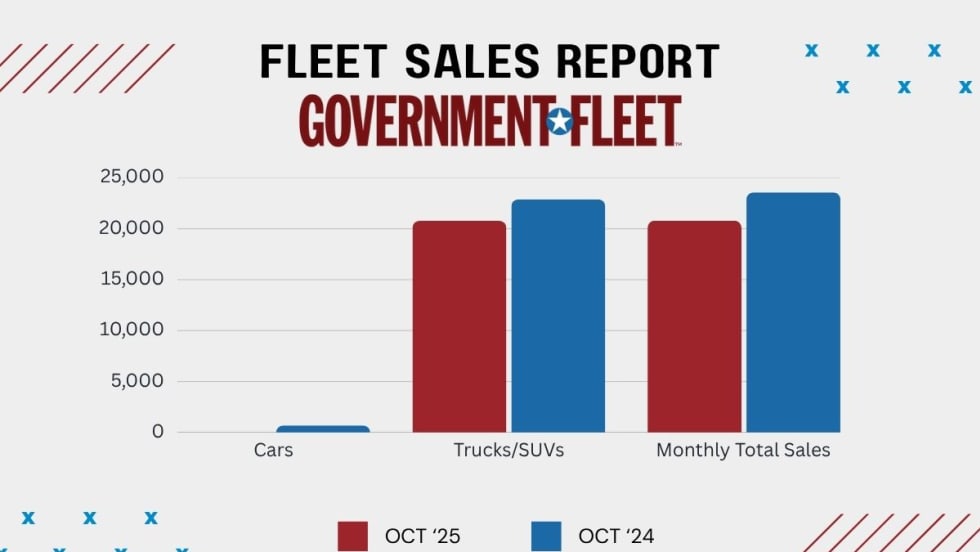
Both car and truck/SUV sales fell year over year, with cars seeing the most significant decrease.

Read More →
Newsby Staff WriterJuly 2, 2025

June Government Fleet Sales Trail 2024 Figures

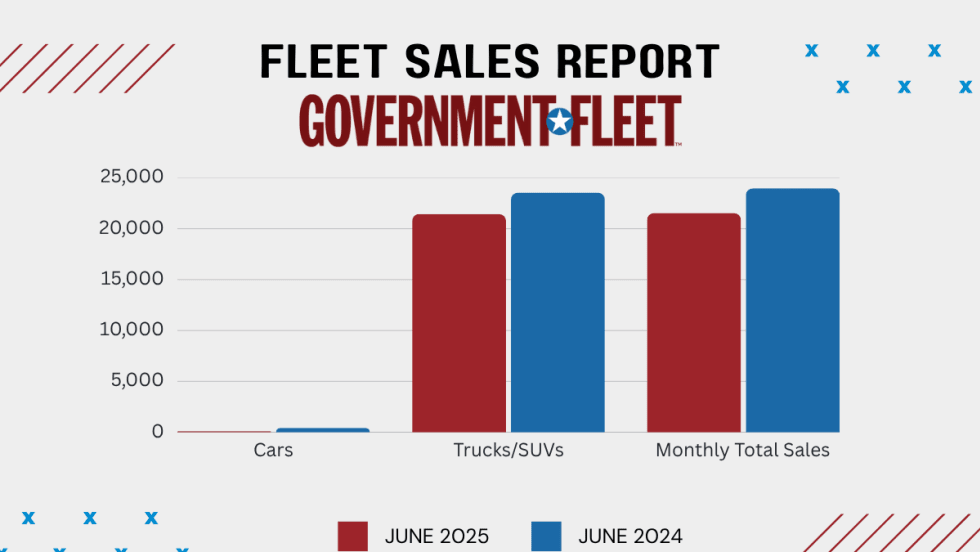
Government fleet sales went from 23,971 vehicles in June 2024 to 21,539 in June of this year.

Read More →
Ad Loading...
Newsby Nichole OsinskiMay 7, 2025

Government Fleet Vehicles Sales See Dip Into April

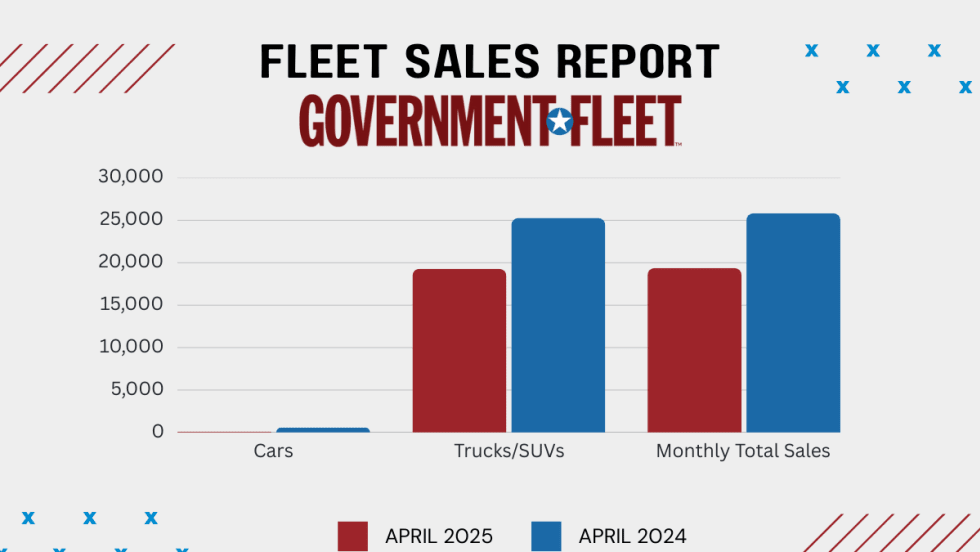
Government fleet sales dropped 25% last month, moving from 25,835 vehicles in April 2024 to 19,385 in 2025.

Read More →
Newsby Nichole OsinskiApril 3, 2025

Government Vehicle Sales See Continued Growth from Beginning of Year

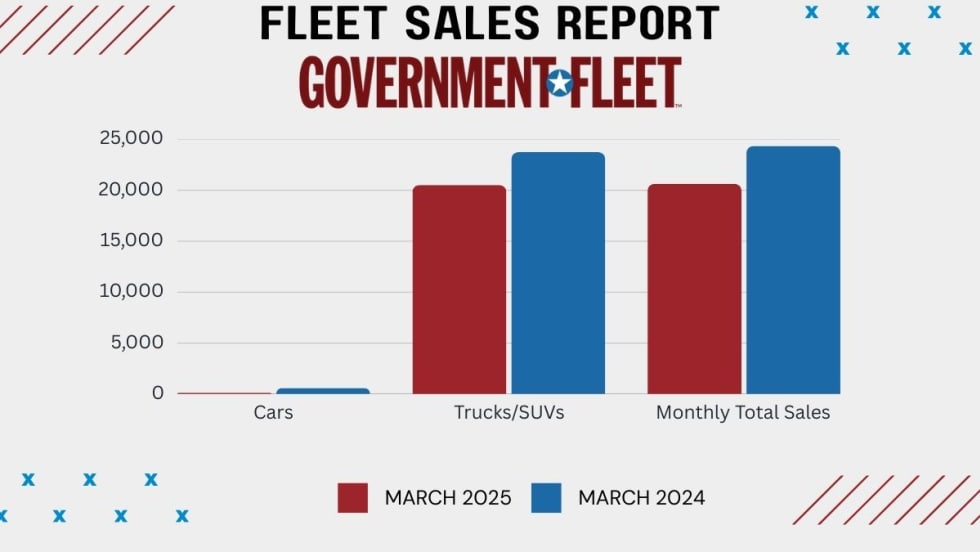
Government fleet sales rose from both January and February monthly totals, which were both under 20,000.

Read More →
Newsby Staff WriterMarch 14, 2025

Government Vehicles Sales See Another Dip Compared to 2024

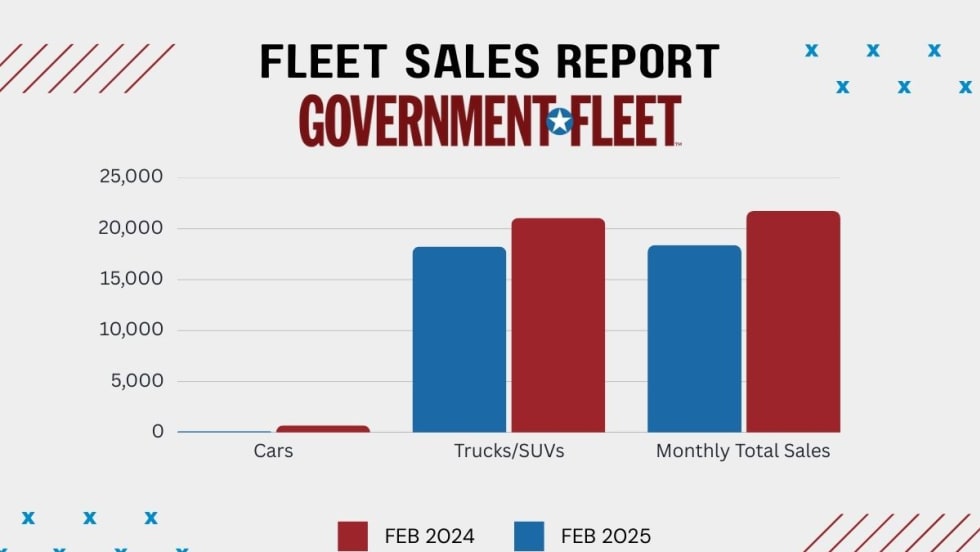
Government fleet sales last month came in at 18,383 vehicles, falling 15.4% from 21,737 in February 2024.

Read More →
Ad Loading...
Newsby Staff WriterFebruary 10, 2025

2025 Government Fleet Sales Starting Below Last Year's Numbers

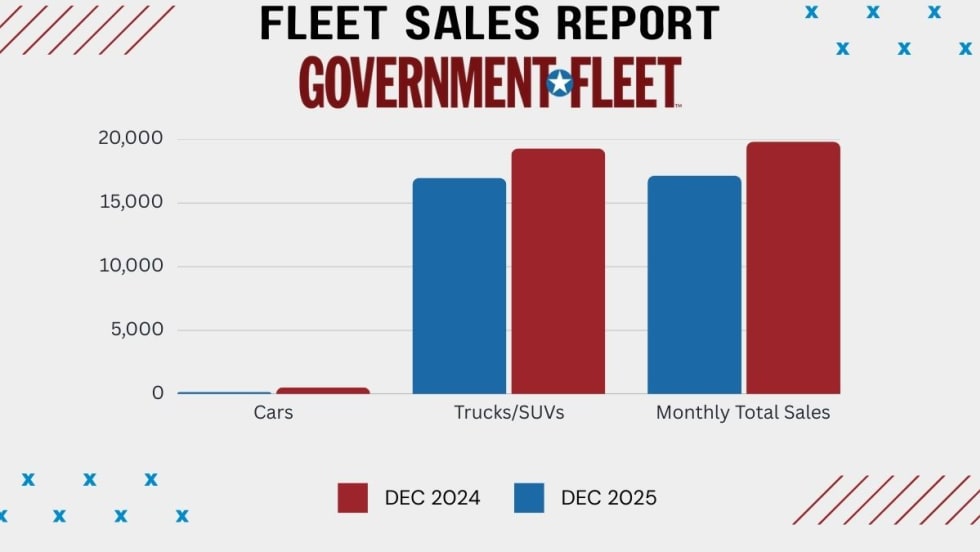
January government fleet sales are below the January 2024 numbers.

Read More →
Newsby Nichole OsinskiOctober 4, 2024

Government Vehicle Sales Dip in September

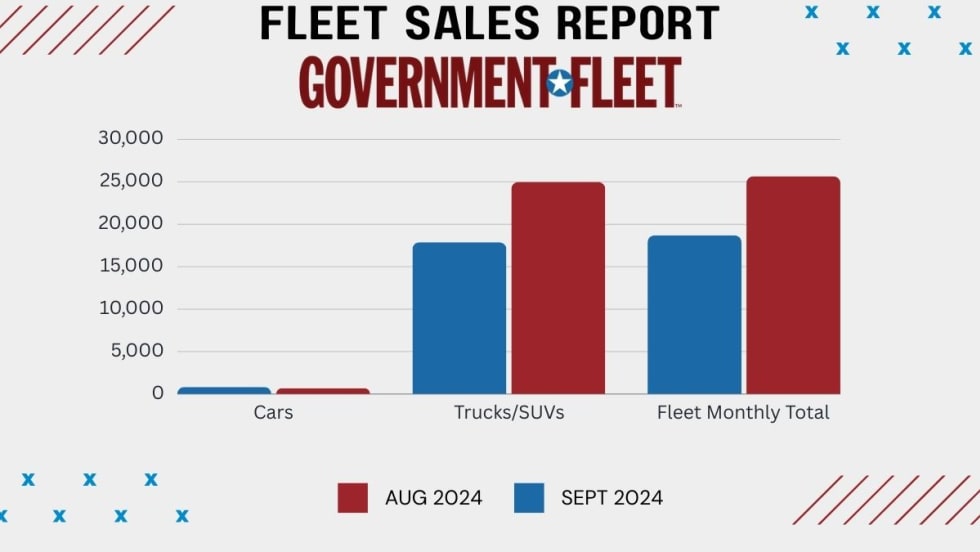
Government vehicles sales fell 12.3% to 18,697 vehicles in September 2024 from 21,319 in September of last year.

Read More →