




Report: Digger Derrick Operating Costs Grow by 81% Over 10-Year Cycle
Utilimarc’s newly released digger derrick report collected data from more than 50 of its utility and municipal fleet benchmarking clients and their active digger derricks.
by Staff
October 5, 2015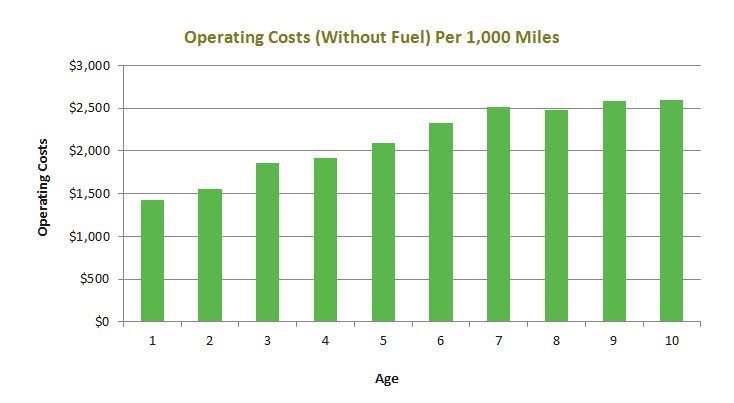
Graph courtesy of Utilimarc
2 min to read
Utilimarc’s newly released digger derrick report shows that the vehicles are driven about 6,000 miles per year, get less than 5 miles per gallon, and are on average 8.5 years old.
Utilimarc collected data from more than 50 of its utility and municipal fleet benchmarking clients and their active digger derricks. The sample shows the average of nearly 12,000 vehicles weighing less than or equal to 55,000 GVWR. The average purchase price of a 2014 digger derrick was $237,225, according to the company.
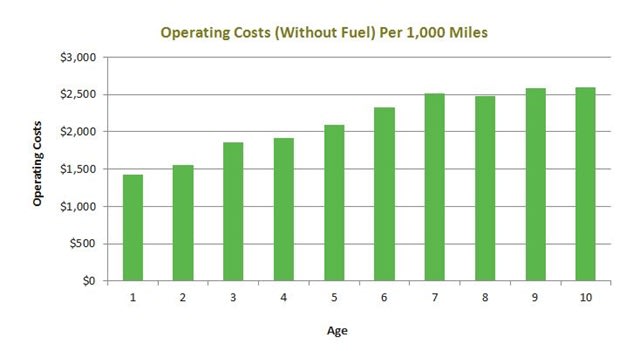
The graph below shows the operating cost (all parts and labor) net of fuel per mile for digger derricks. As the vehicles age, operating cost per 1,000 miles also increases.
Graph courtesy of Utilimarc
The overall operating cost for digger derricks in year one was $1,430 per 1,000 miles, while in year ten it was $2,589 per 1,000 miles, an increase of $1,159 or 81% over the 10 years. The average operating cost per 1,000 miles for the digger derrick over the same 10-year period was $2,132.
This graph shows the average miles driven from 2010 to 2014 for the digger derrick. The annual average miles driven between 2010 and 2014 varied, with the most being 6,301 miles and the least being 5,795 miles. The average miles driven from 2010 to 2014 is 6,094.
This graph shows the average miles per gallon (MPG) from 2010 to 2014. The annual average MPG between 2010 and 2014 varied, with the highest MPG being 4.95 and the lowest MPG being 4.45. The average MPG from 2010-2014 is 4.68.
This graph shows the average number of days between an unscheduled/demand repair event from 2010-2014. The digger derrick historically has an average of 16.8 days between unscheduled/demand repair event.
This graph shows the average number of days between a scheduled/preventive maintenance event from 2010-2014. The digger derrick historically has an average of 49.9 days between a scheduled/preventive maintenance event.
Graph courtesy of Utilimarc
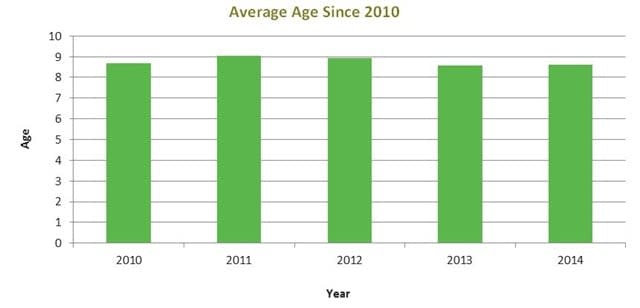
This graph shows the average age of the digger derrick from 2010-2014. The average age has varied since 2010, with the highest age of 9.03 years in 2011 and the lowest age of 8.56 in 2013. In comparison, the year with the highest average age for the heavy-duty bucket truck was 2013, at 8.07, and the average age from 2010-2014 was 7.65. The digger derrick historically has an average age of 8.76.
To learn more about the data provided here, visit www.utilimarc.com/demo.
More Operations
Is Keeping Older Fleet Vehicles Really Saving Money?
Is keeping vehicles longer saving money, and what happens when a diagnostic test points to the wrong fix?
Read More →
How Smart Fleet Strategy Can Help Local Government Agencies Do More with Less
Keeping a vehicle longer may ease this year’s budget, but what does it cost the next one? A closer look at fleet decisions can reveal opportunities to reduce spending while protecting essential services.
Read More →
Connect with Government Fleet on LinkedIn
From industry news and fleet management strategies to conversations with peers, Government Fleet's LinkedIn page offers public-sector fleet professionals another way to stay informed and connected.
Read More →
Town of Queen Creek Named Most Successful Fleet Award Winner of Inaugural RTA Fleet Success Awards
Five fleets were honored at RTA Connect 2026 in Chicago for excellence across resource efficiency, intentional culture, risk management, and stakeholder satisfaction.
Read More →
Sponsored•October 14, 2026
A buyer's guide to fleet management software in 2027
Buying fleet management software in 2027 means looking beyond features and price. As fleet operations, technology and expectations evolve, this guide explores what today’s fleet professionals should consider when choosing a system that can deliver value now and adapt to what comes next.
Read More →
Hazard Alerts, Fleet Car Sales Rise and a New Shuttle Concept
Fleet car sales doubled, but the bigger picture tells a different story in this week’s roundup.
Read More →
How St. Johns County Turned Fleet Data Into Better Replacement Decisions
St. Johns County, Florida, had fleet data, but turning it into reliable decision guidance was another matter. Instead of starting over with a new fleet management system, the county connected existing tools and built a scoring system that gives managers an objective look at fleet health.
Read More →
Fleet Forward Conference Introduces One-Day Passes for 2026
New one-day registration lets fleet professionals attend Tuesday, Wednesday, or Thursday, with passes available for $249.
Read More →
ENC Unveils its ZAVIR Medium-Duty Shuttle
Two variants of the concept shuttles were revealed: a low-floor configuration and a high-floor configuration.
Read More →
Could Your Next Fleet Technician Start as an Intern?
What if your next technician hasn’t worked in a fleet shop yet? What fleets are doing to free up time.
Read More →