

Related: Report Compares Half-Ton Pickup Costs, Uses in Utility Fleets
Utility Service Trucks Analyzed in Benchmarking Study
Utilimarc's benchmarking report for light-duty service trucks uses data from 40 utility fleet clients and includes more than 3,600 vehicles under 20,000 GVWR with a service body without an aerial device.
by Staff
May 8, 2015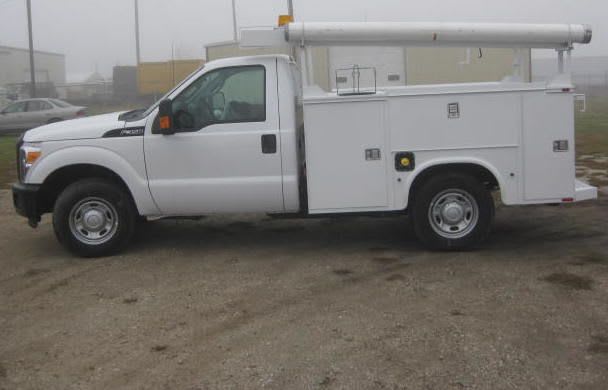
Photo courtesy of Utilimarc.
3 min to read
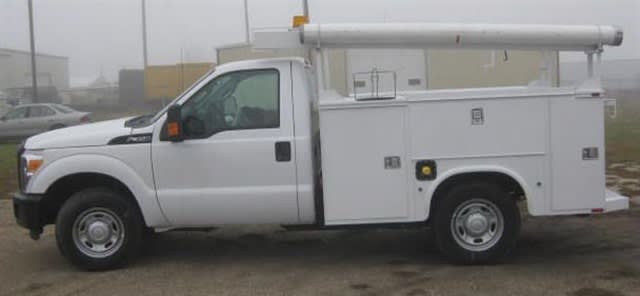
Photo courtesy of Utilimarc.
Utilimarc recently released a benchmarking report for the costs and uses of active light-duty service trucks. The report uses data from 40 utility fleet clients and includes more than 3,600 vehicles under 20,000 GVWR with a service body and without an aerial device.
Average Purchase Price by Year
This graph shows the average purchase price of light duty service trucks over the past eight years, broken down by drive type. The overall trend for both drive types is that the average purchase price is increasing.
From 2006 to 2013, the average purchase price for a 4x2 increased from $36,979 to $46,181, which is an increase of nearly 20%.
From 2006 to 2013, the average price for the 4x4 increased from $44,722 to $52,796, which is an increase of more than 15%.

Graph courtesy of Utilimarc
Operating Costs (Without Fuel) Per Mile
This graph shows the operating cost (all parts and labor) net of fuel per mile for 4x2 and 4x4 light duty service trucks by age. The overall trend for both drive types is that the operating cost per mile is increasing as the vehicle ages.
The operating costs for 4x2 in year one was $0.19 per mile, while in year 10 it was $0.35 per mile, an increase of $0.16 over the 10 years. The average operating cost per mile for a 4x2 pickup over the same 10-year period was $0.27.
The operating costs for 4x4 in year one was $0.20 per mile, while in year 10 it was $0.38 per mile, an increase of $0.18 over the 10 years. The average operating cost per mile for a 4x4 pickup over the same 10-year period was $0.30.

Graph courtesy of Utilimarc.
Average Miles Driven by Year
This graph shows the average miles driven from 2009 to 2013 for the 4x2 and 4x4 light duty service truck. The annual average miles driven between 2009 and 2012 remained consistent for both the 4x2 and 4x4. 2013 saw a decrease in annual miles driven for both 4x2 and 4x4.
For the data set above, the 4x4 pickup has historically driven more miles annually than the 4x2. From 2009-2013 the 4x4 was driven an average of 2,168 more miles annually than the 4x2.

Graph courtesy of Utilimarc.
Average Number of Days Between Unscheduled/Demand Repair by Year
This graph shows the average number of days between an unscheduled/demand repair event from 2009-2013 for the 4x2 and 4x4 light duty service truck.
From 2009-2013 the 4x2 remained consistent in amount of days between the average number of days between an unscheduled/demand repair. From 2009-2013 the 4x4 saw a decrease in the average number of days between an unscheduled/demand repair. The 4x4 historically has an average of 47 days between unscheduled/demand repair. The 4x2 historically has an average of 39 days between unscheduled/demand repair.

Graph courtesy of Utilimarc.
Average Age Since 2009
This graph shows the average age of vehicles from 2009-2013 for the 4x2 and 4x4 light duty service truck. The average age of both the 4x2 and 4x4 has steadily increased since 2009.
The average age for the 4x2 increased by 1.36 years from 2009 and 2013, while the 4x4 increased by 1.07 years from 2009 to 2013.

Drive Type Percentage Since 2009
This graph shows the drive type percentage breakdown of light duty service trucks between 2009-2013. The 4x4 drive type percentage has seen a slight increase over time, from 43% in 2009 to 48% in 2013.

Graph courtesy of Utilimarc.
To learn more about the data provided here, visit www.utilimarc.com/demo.
More Maintenance

Reducing Long-Term Maintenance Costs and Downtime
Downtime is rarely caused by a single surprise failure but rather by an issue that builds over time through setbacks ranging from deferred maintenance to poor replacement planning. So what's the fix?
Read More →
The Future of Government Fleet Technicians with Mike Cleary
Insight on preparing for hybrid and electric vehicle service, what fleets need to know about recruiting technicians in a competitive market, and how to make the most of limited training budgets.
Read More →
Work Orders Are More Than Records. They're a Roadmap to Fleet Availability
What if your work orders could predict failures, uncover hidden costs, and boost fleet availability? Here's how leading fleets are using the data.
Read More →
Drive More Profit with Greater Fleet Uptime
Fleet downtime costs money. JASPER helps keep vehicles on the road with quality remanufactured components, fast nationwide delivery, and reliable solutions that boost uptime and profitability.
Read More →
Sponsored•May 13, 2026
The Fleet Efficiency Gap: Where Budgets, Utilization & Risk Collide
Departmentally assigned vehicles often create hidden costs through underutilization, poor visibility, and increased administrative burden. This whitepaper explores how shared motor pool strategies help fleets reduce costs, improve accountability, and optimize vehicle utilization.
Read More →
Smart Seasonal Maintenance Tips for Government Fleets
Government fleets carry extra weight, and routes, schedules, and public trust depend on reliability. A systematic spring checklist keeps vehicles in service when agencies need them most.
Read More →
BendPak Debuts 12APF Two-Post Lift for Tall Vehicles in Low-Ceiling Shops
New 12,000-lb. open-top lift designed for commercial vans, trucks, SUVs, and fleet vehicles
Read More →
Sponsored•March 26, 2026
Reducing Risk and Improving Safety in Public Sector Fleets with Advanced Driver-Assist Technology
Public sector fleets face increasing pressure to improve safety, reduce liability, and operate efficiently. See how advanced vehicle technologies are helping agencies protect drivers, the public, and their budgets.
Read More →
Fleetio Launches AI Service Advisor to Simplify and Accelerate Fleet Maintenance Approvals
Fleetio launched an open beta of its AI-powered Service Advisor tool, designed to help fleet managers streamline repair approvals and reduce vehicle downtime.
Read More →
The Future of Government Fleet Technicians with Mike Cleary
Mike Cleary shares what government fleets need to know about today’s technician workforce, EV and hybrid service demands, recruiting skilled talent, and making training dollars go further.
Read More →