




DriveCam Insights Focus on Waste Fleets
SAN DIEGO - A DriveCam study focuses on the distribution of collisions and near collisions identified in 2009 by month, day, and year, specifically comparing commercial waste fleets to an aggregation of commercial fleets in various other industries.
SAN DIEGO - DriveCam Inc., a global driver risk management company, continued its Insights Series by focusing on the frequency of collisions and near collisions in waste fleets. In Waste Insights release #1, DriveCam explored the collision rates of different vehicle types in the waste industry.
DriveCam's Video Event Recorder is capable of identifying collisions and near collisions that could have been avoided. This study focuses on the distribution of the collisions and near collisions identified in 2009 by month, day, and year, specifically comparing commercial waste fleets to an aggregation of commercial fleets in various other industries (construction, distribution, energy, utilities, telco, and transit).
Collisions/Near Collisions by Month of the Year
The waste industry collision/near collision rate is not significantly different from that of other industries over the course of the year
The top three months for collisions/near collisions in the waste industry are July, October, and November (11 percent, 12 percent, and 11 percent respectively)
January and February mark the low point of the year for collisions/near collisions at 5 percent
Collisions/Near Collisions by Day of Week
The waste industry has a near identical collision/near collision rate compared to other industries on Mondays and Tuesdays
However, the waste collision/near collision rate is higher than other industries from Wednesday to Friday with a peak on Fridays (21 percent in waste compared to 18 percent in other industries)
Collisions/Near Collisions by Hour of Day
The waste industry collision/near collision frequency rate is at its lowest between 11 P.M. and 9 A.M. (a total of 15 percent of collisions/near collisions happen during this time)
The collision/near collision frequency rate begins to ramp up at 9 A.M. peaking sharply between noon and 1 P.M. (9 percent) and does not dip below 7 percent until 5 P.M.
Nearly half (48 percent) of all collisions/near collisions in the waste industry occur between noon and 6 P.M., compared to 39 percent in other industries
More information can be found on the DriveCam Web site.
More Safety
New Partnership Aims to Expand Public Digital Hazard Alert System Statewide
The Hawai’i Department of Transportation (HDOT) is expanding advance digital hazard alerts for the public statewide.
Read More →
New York City Expands Safety Technologies Across Municipal Fleet
Executive Order 19 moves intelligent speed assistance and pedestrian alerts from pilot programs toward standard fleet equipment, offering other public fleets a look at how safety technology can be tested, measured, and scaled.
Read More →
Hidden in Plain Sight: Fleet Compliance Risks
Fleet compliance isn't just about having policies — it's about consistently enforcing them. This practical guide reveals six hidden compliance risks common in public sector and shared fleet operations and outlines proven strategies to improve visibility, accountability, and audit readiness.
Read More →
5 Days Left to Submit Your 2026 Fleet Safety Award Nomination
Know a government fleet, safety, or risk manager who deserves recognition for making fleet operations safer? Nominations are open through Aug. 15.
Read More →
How the First 24 Hours Can Shape a Fleet Crash Response
How a strong accident response process helps government fleets move from the initial report to recovery while building a clearer record for what needs to change next.
Read More →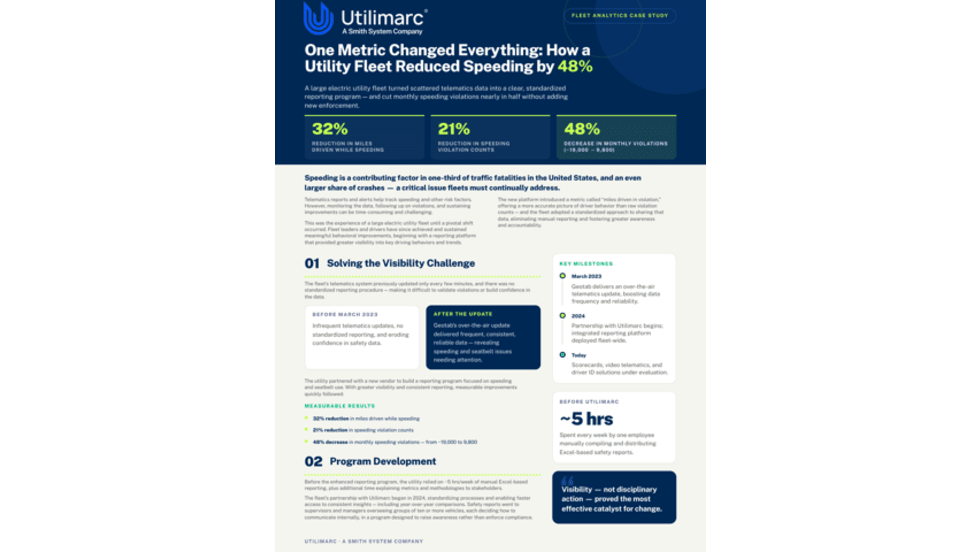
How Better Visibility Cut Speeding Violations by 48%
Fleet leaders don't need more data, they need clearer visibility into what the data is saying. This case study explores how one utility replaced speeding-event counts with a single metric — miles driven in violation — to strengthen safety and significantly reduce speeding violations.
Read More →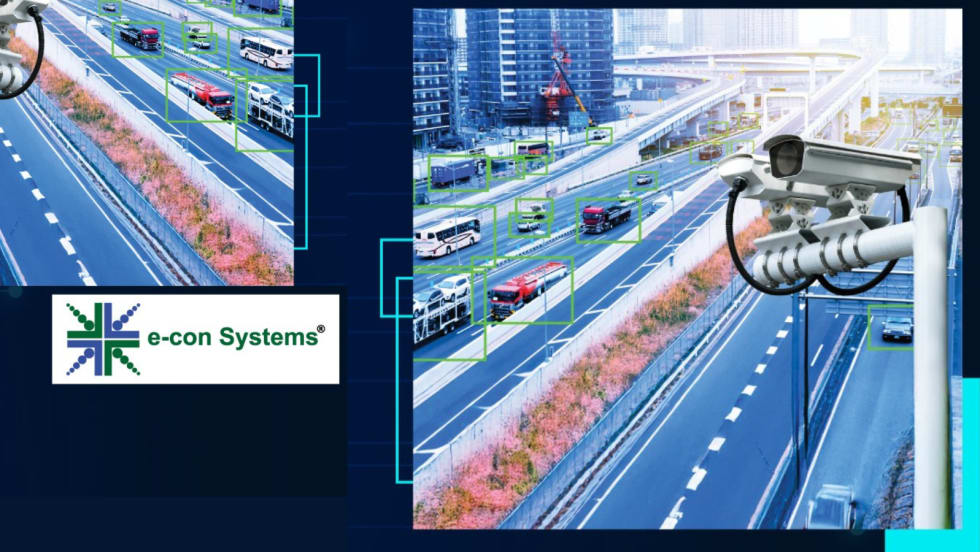
e-con Systems Expands AI Camera Tools for Traffic Monitoring
The systems support license plate recognition, traffic analytics, and video management for transportation agencies.
Read More →
King Township Pilot Links Driver Feedback to Reduced Speeding
How King Township, a best-in-class municipal fleet, reduced speeding by 10.9% and demonstrated a projected 349% ROI by putting safety ownership directly in drivers' hands.
Read More →
Beyond the Fireline: The Critical Role of Public Fleets in Wildfire Response
Behind every wildfire response is a complex network of vehicles, data, and decisions that must work in sync under extreme pressure. Global heating trends require strong fleet coordination and reliable communications to keep crews safe and operations running smoothly.
Read More →
How AI Is Transforming Public Fleet Safety - Part 1
AI-powered safety systems are helping public fleets tackle distracted driving by delivering real-time coaching and measurable behavior change behind the wheel. In part one of our Q&A, Nauto CEO Stefan Heck explains how agencies can improve safety, reduce costs, and navigate implementation challenges with AI-driven technology.
Read More →