

Using Your Internal Service Fund to Its Fullest Potential
Rate development, billing and collection methods, and policy changes within an internal service fund can be used to drive good asset management behavior.

Rate development, billing and collection methods, and policy changes within an internal service fund (ISF) can be used to drive good asset management behavior and improve your organization’s flexibility.
Photo: Getty Images
In local governments, budget season is kicked off with rate and fee development for enterprise and internal service funds (ISFs). Although ISF rate development is done by either the operating department or budget office, the process gives both groups the ability to manage budget issues and drive good behaviors. Exploring some of the nuances of rate development can help avoid methodologies that drive bad behavior and allow agencies to improve their bottom line.
The question for the rate development team is: Are you using your ISF and rate development to its fullest potential? Let’s look at some methods in rate development that will help you do so.
Improved Budget Compliance and Forecasting
One of the benefits of a fully utilized ISF is the ability to eliminate expense spikes. This can be done through fixed maintenance costs and fuel hedging.
Consider the Benefits of Fixed Maintenance Costs
Fixed maintenance charges can eliminate expense spikes and make cost projecting easy and accurate. Although calculating time and materials is the most accurate maintenance cost allocation method, it can create cost spikes. For example, a fleet of 100 heavy dump trucks has a relatively uniform expense year over year. But, for a small department with only two trucks, a major component failure for both may result in a maintenance cost overrun in the first 60 days of the fiscal year.
If maintenance charges are applied on a per-period or per-mile basis, the expenses are smoothed out over the fleet from year to year and cost projections are easier and more accurate, with no threat of budget overruns. See Table 1 for a fixed rate calculation that uses developed shop rates:
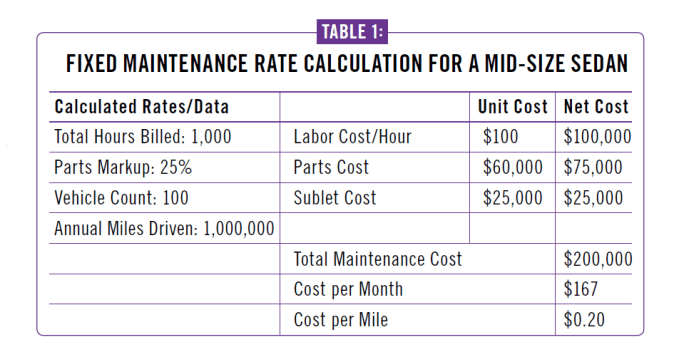
This fixed rate calculation uses developed shop rates to determine how much to charge users per period or per mile.
Which method is better? Cost per mile is more common, but I would suggest rate developers look closer at the cost per period. A fixed cost per month allows forecasting with near 100% accuracy, as the only changes from the first billing period would be fleet additions (already known and can be projected) and accident vehicles taken out of the fleet early (the only unknown). It also takes the smoothing impact of the costs and provides the best value for the vehicles that are driven more miles in the period. This “benefit” for high-mileage vehicles will cause the user to look harder at low-use assets for potential turn-in, the best long-term money saver in any operation. If minimum mileage charges are available, cost per mile can accomplish the same goal. See Table 2 for the benefits and disadvantages of various billing methods:
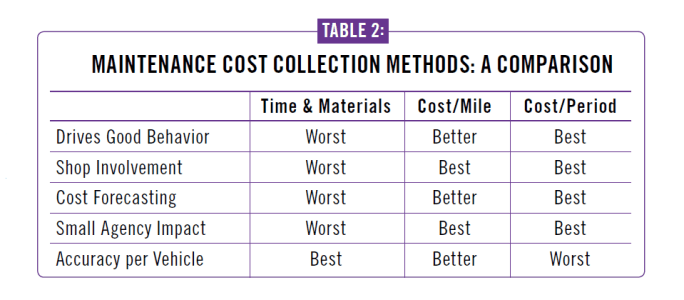
While time and materials is the most accurate way to recoup costs, other methods are better for influencing user behavior and overall ease of operations.
“Hedging” Fuel Frees Up the Budget
The ability to hedge fuel — fixing/capping prices for a fixed period of time — is probably the most valuable tool of an ISF. The commercial “hedging” process can be replicated by utilizing the ISF and reserves as the hedging source instead of a third-party vendor. Fuel hedging allows an agency to be much more aggressive in fuel price estimating versus “cushioning” fuel estimates to prevent overruns. The result is that additional funds are freed up for budgeting other needs.
The premise utilizes two options. Fuel is “set” at a price for the year regardless of actual cost, or a price “ceiling” is established and fuel is set to budget only when the year-to-date average price is exceeded. See Tables 3 and 4 showing County X and its fuel budget calculations and expenditures for two years under the hedging scenarios:
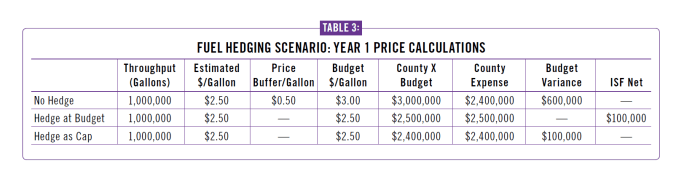
In this projection, actual fuel costs are $2.40 per gallon. Throughput is 1 million gallons. The internal service fund pays $2.4M.
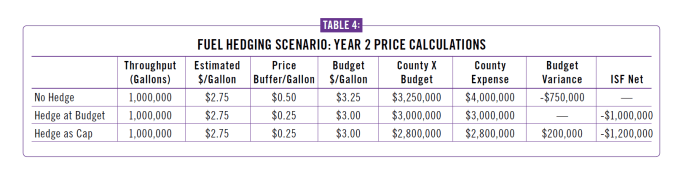
The commerical “hedging” process can be replicated by utilizing the internal service fund and reserves, using a “set” price and a price “ceiling.” These tables show projected fuel calculations and expenditures for two years under the hedging scenarios.
The shortfall in Year 2 will have a huge impact on staffing and levels of service. However, it allows 1) more budget funds to be allocated to other activities up front, 2) a “buffer” to hold the shortfall for a period of years and allow funds to be recovered gradually with much smaller impacts on the budget, and 3) the “buffer” to be funded by years where fleet management over-collects, such as in Year 1. It’s a win-win for all concerned.
A common reaction to this is: “Departments need to manage fuel costs internally — it’s part of their job description.” After more than 20 years of budgeting and rate development, I disagree. For General Fund government operations, one-time cost spikes have a huge operational impact, and any way to avoid them should be utilized.
For example, fuel spikes of $1/gallon on a Parks Department that uses 50,000 gallons a year will almost certainly result in at least one full-time employee cut sometime during the year. Additionally, the staff may scramble to make other operational cuts to accommodate the fuel overruns in that fiscal year. Hedging fuel prices allows operations and service levels to remain unchanged and provides much-needed time for budget staff to plan a recovery. With these capabilities at the disposal of most agencies, fuel costs should be managed through the ISF.
Fleet Policies That Reinforce Good Asset Management
A big potential cost savings for any agency is turning in underutilized equipment.
Most agencies dictate additions to the fleet be funded by the user department, with the ISF collecting replacement funds to replace the asset. It is easy for departments to carry over budget requirements for assets already assigned, but very difficult to get authorizations for additions. This creates the mentality of “I can’t turn it in because if I need it later, I can’t get it back.”
A policy allowing turn-in with no penalty and an opportunity to get the vehicle back in case of need (within a reasonable time frame) will help improve this situation. For example, an SUV that is three years old on a six-year vehicle lifespan is determined by the user to be excess. The user department turns the vehicle in to save ongoing replacement and operating costs. Two years later, the department experiences growth and is able to request another SUV without the buy-in, funded by the ISF. (Yes, this does create a small gap between three years of SUV replacement collection plus sale revenue, minus the cost for a new unit).
A “protected” use of rental vehicles is another good policy to encourage vehicle turn-in. For example, if a department can spend $5,000 in annual equipment rentals versus $10,000 in maintenance and replacement costs of agency equipment, it receives budget “protection” to carry that rental cost in future years (a 2:1 cost savings is a good place to start with justifying use of rental equipment). However, when rental budgets are “raided,” user agencies will keep excess equipment.
These are just two methods to give the user department an opportunity to make cuts without causing permanent “damage” and will generally result in better management of underutilized assets for your agency.
Other Techniques for Your Fleet's ISF
Pricing
Sometimes all SUVs or sedans are lumped into one billing class. Ensuring the fleet’s most cost-effective sedans or SUVs are in their own class instead of lumped in with more expensive vehicles gives customers the opportunity to make the best decision when they choose vehicles.
Point-of-Sale Transactions
Fuel transactions exemplify how the way fees are collected can drive behavior. City A supplements its fueling sites with credit cards. Drivers may look at commercial fuel prices to determine the best value. If they see the agency’s fuel price of $2.10/gallon ($1.85/gallon cost, plus $0.25/gallon markup) and the nearby gas station is at $2.08/gallon, they may incorrectly believe they are saving money by using the vendor. They don’t see that the agency must pay the infrastructure and support costs regardless, and instead of paying their own agency the $0.25/gallon, they pay the vendor an additional $0.23. This scenario has a spiral effect, as every gallon purchased outside the agency causes the next year’s markup to be higher as the fuel site volume decreases.
A solution is to apply the charge per gallon in a lump sum at the beginning of the year and sell fuel at cost. The calculation takes the cost of supporting the fuel activity and distributes it through all departments based on the previous year’s fuel throughput, including credit card volume. See Table 5:
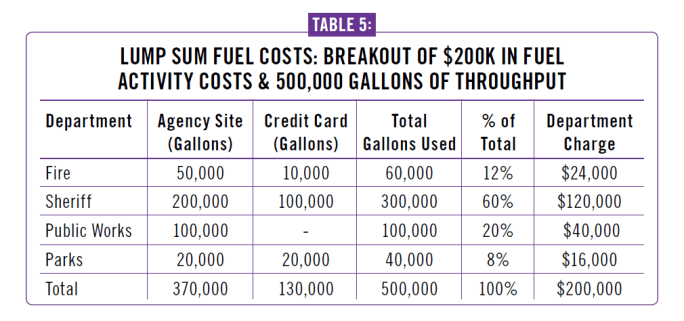
Charging per gallon in a lump sum at the beginning of the year can help fleets recover the cost of supporting the fuel activity, including credit card volume.
Charging for credit card use is valid, as the burden of savings is borne by the user agency, not the ISF. That is, if the user agency determines that using the card will save more than traveling back to the agency fuel site, it recoups those savings but must still pay for infrastructure.
Fees
Two common fees for modifying behavior are minimum usage and idling.
The minimum usage concept is that a low-usage vehicle can cause a shortfall in cost recovery. Assume Department A drives a vehicle 160 miles over a six-month service interval. It is charged $0.35 per mile and generates $70 in maintenance revenue for the ISF, perhaps enough to keep up with preventive maintenance costs but not enough for costs such as breakdowns, belts, or tires. Charging a minimum amount of miles per month (maybe the 300-400 range) can solve this problem.
ISFs should track the additional revenue and reduce the following year’s rates for other vehicles. Consider a vehicle class driving 100,000 miles with $30,000 of operating costs that is charged $0.30/mile. If a minimum mileage charge caused the previous year to have additional revenue of $3,000, then the rate for the next year can be set at $0.29/mile, creating a reward for the agencies using their vehicles appropriately, driving better behavior in the future.
For agencies with telematics, idling fees can be applied very similarly to the minimum mileage charge. Although most fleet management systems aren’t set up with capability, a second “odometer” for idle time can be created and fed through the telematics device or pulled separately. Like the minimum usage fee, idling charges should be set up to provide a reduction for the class of vehicles.
These are some examples of how ISF rate development, collection methodologies, and policy can be used to drive better user behavior and provide your agency with more flexibility in future budget years. Hopefully, your agency’s procedures will allow you to take advantage of some of these techniques.

About the Author: Brent Wahl is director of fleet management at Pasco County, Fla. He can be reached at BWahl@pascocountyfl.net.
More Operations

The Network Behind Better Government Fleet Decisions
A discussion on why relationships across the government fleet community have played such an important role and what shapes the leadership response.
Read More →
Ford, BlackRock, Google and Carhartt Form Skilled Trades Workforce Alliance
The alliance plans to develop a stronger pipeline between training programs and available jobs while examining workforce efforts already underway across the country.
Read More →
The Network Behind Better Government Fleet Decisions
A discussion on why relationships across the government fleet community have played such an important role and what shapes the leadership response.
Read More →
What Makes Fleet Technicians Stay? | GovCast Cheat Sheet
The technician hiring and retention discussion is not new, but the way fleets respond to it continues to matter.
Read More →

On the Road with Government Fleet: Essential Podcasts for Professionals
Let's celebrate listening! Check out a GovCast podcast and discover the insights and strategies that can transform your fleet management approach.
Read More →
How Real-World Vehicle Use Guides Replacement And Budgets
Three public fleet leaders explain how they use real-world vehicle data and long-term planning to keep aging assets in service and make more informed replacement and budgeting decisions in a high-cost environment.
Read More →
When Fleet Data Has to Actually Mean Something | GovCast Cheat Sheet
Better fleet technology only works when the information behind it can actually support decisions.
Read More →
Why Public Fleet Success Depends on More Than the Vehicles | From the Show Floor with Tim Coxwell
Fleet decisions rarely stay inside the garage. From funding pressure to emissions planning, Tim Coxwell explains what it takes to keep a sheriff’s office fleet moving while planning for what comes next.
Read More →
How Government Fleets Helped Build America
As the United States celebrates its 250th anniversary, this look back explores how government fleets evolved from horse-drawn wagons to specialized vehicles that keep communities running today.
Read More →