

2021 Industry Statistics
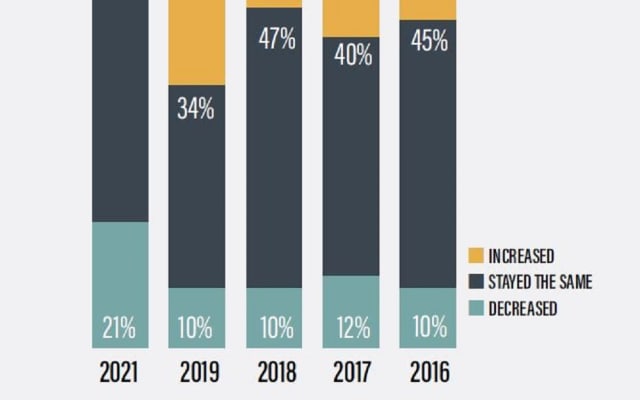
Data from Government Fleet’s biennial industry survey shows more fleets reported size decreases this year than previous years, and the pandemic led to decreased operating and replacement budgets.

Data from Government Fleet’s biennial industry survey shows more fleets reported size decreases this year than previous years, and the pandemic led to decreased operating and replacement budgets.

Government fleet professionals gathered at the Honors Celebration to commend the top fleets in the U.S. and Canada and the people who lead them.

The 2019 Government Fleet Expo & Conference exhibit hall featured new vehicles, products, educational sessions, and more.

Attendees of the 2019 Government Fleet Expo got to test-drive new vehicles, learn about new fleet technology, and play games during the Block Party.
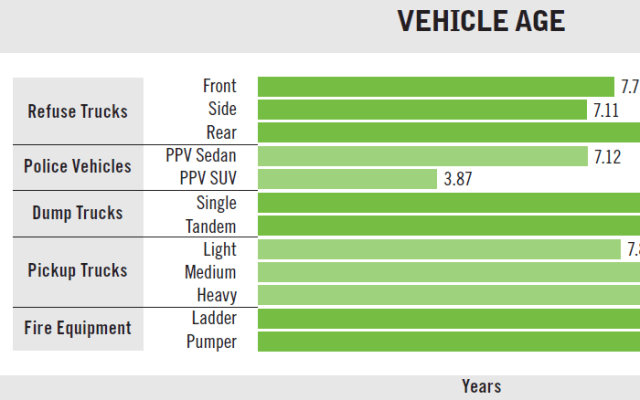
Data derived from Utilimarc's municipal benchmarking clients shows that vehicle age and maintenance cost per mile have increased across several classes.
Data from Government Fleet's survey shows fewer fleets reporting size increases compared to last year, and a slight rise in those reporting operating budget increases.

Every year at the 2018 Government Fleet Expo & Conference, public fleet professionals gather to celebrate the industry and recognize the achievements of high-performing fleets.

The 2018 Government Fleet Expo & Conference took place June 4-7 in San Diego, Calif. Public sector fleet professionals, suppliers, and other members of the industry gathered to discuss the state of the industry.
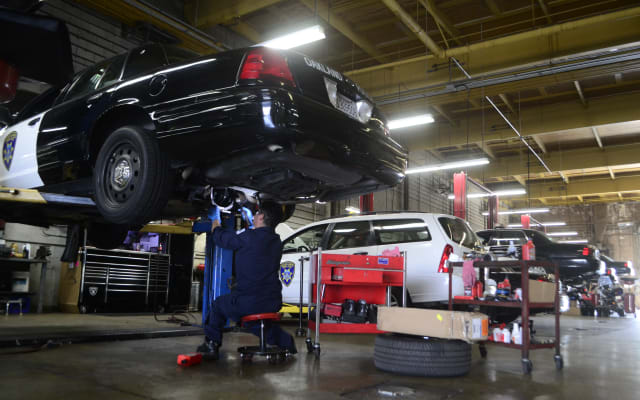
The City of Oakland Fleet Management Division maintains about 1500 on-road assets across two locations. The fleet recently started a financing program, that allows it to catch up on vehicle purchases following a 12-year freeze on replacements. In addition, the fleet has gotten greener, with the use of compressed natural gas, reenwable diesel, and battery-electric vehicles. Photos by Thi Dao
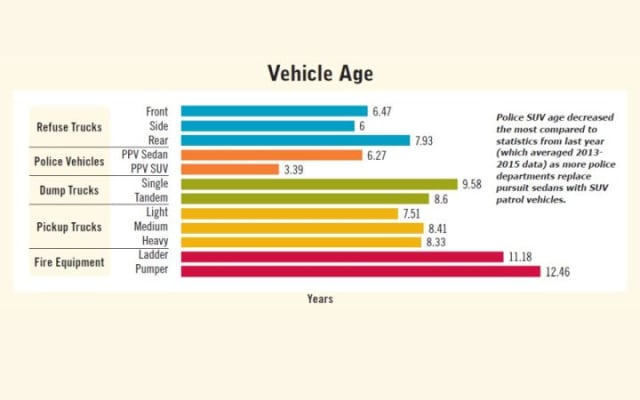
Data from this gallery is derived from 15 of Utilimarc’s municipal benchmarking clients (cities, states, and counties), providing 34,000 data points. Each of the numbers presented is an average over the years 2014-2016.
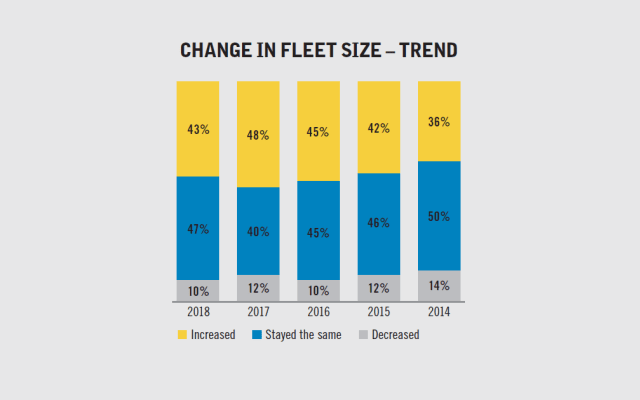
Data from Government Fleet’s annual survey shows a continuing rise in the size of public fleets, and that fleets are working on catch-up replacements from the recession. About the data: In July and August, Government Fleet magazine solicited responses to an annual survey from its readership, receiving 142 qualified responses. All charts in this gallery come from this opt-in survey.