

2018 Utilization Statistics
Data in this gallery is derived from 31 of Utilimarc's municipal benchmarking clients (cities, states, and counties) providing 44,000 data points. Each of the numbers presented is an average over the years 2015-2017. For these charts, a light truck is defined as 1/2-ton, medium truck as 3/4 ton, and heavy is a full ton or more.
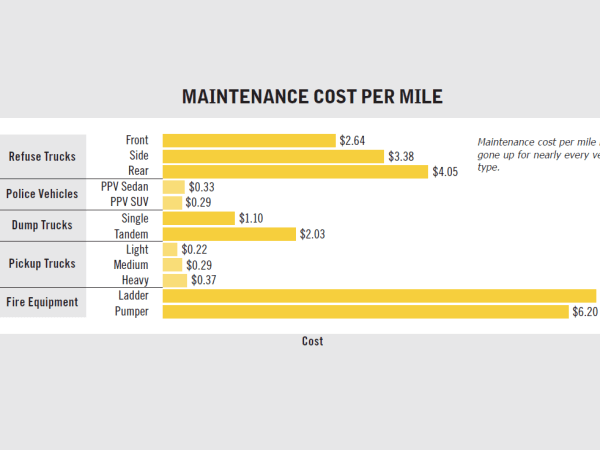
Maintenance cost per mile has gone up for nearly every vehicle type.
Source: Utilimarc
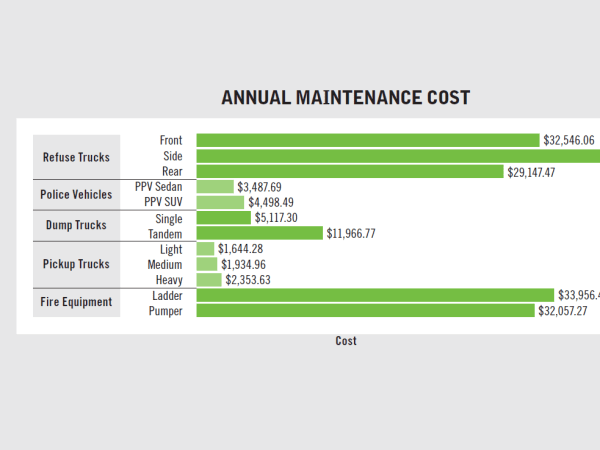
Annual maintenance cost has decreased for pickup trucks and dump trucks but has risen significantly for fire engines in comparison to 2017 data.
Source: Utilimarc
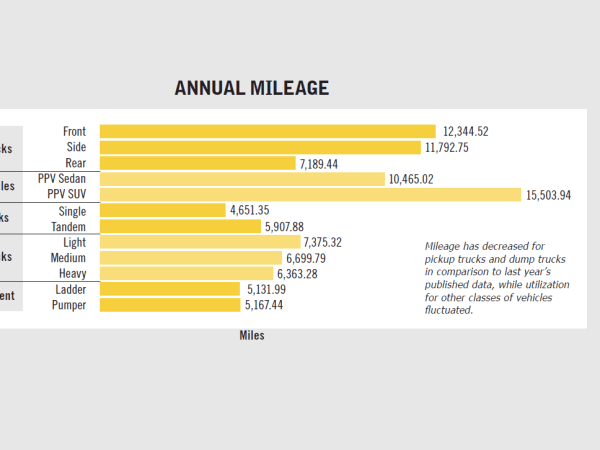
Mileage has decreased for pickup trucks and dump trucks in comparison to last year's published data, while utilization for other classes of vehicles fluctuated.
Source: Utilimarc
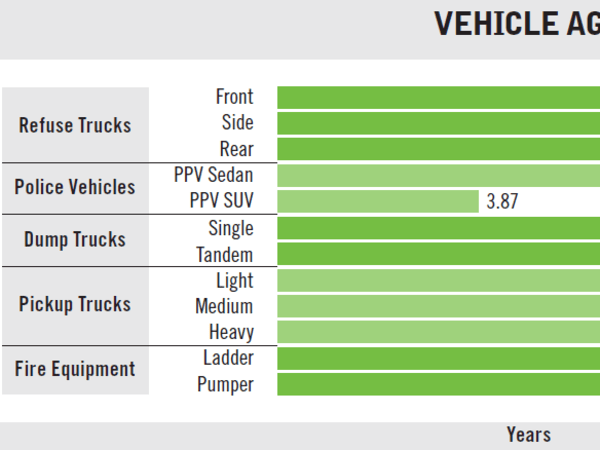
Vehicle age has increased across every class compared to statistics from last year (which averaged 2014-2016 data).
Source: Utilimarc
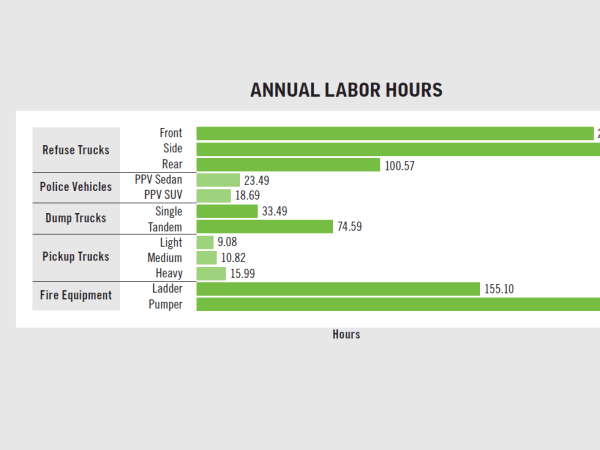
Refuse trucks and fire equipment continue to require the most labor to maintain and repair.
Source: Utilimarc
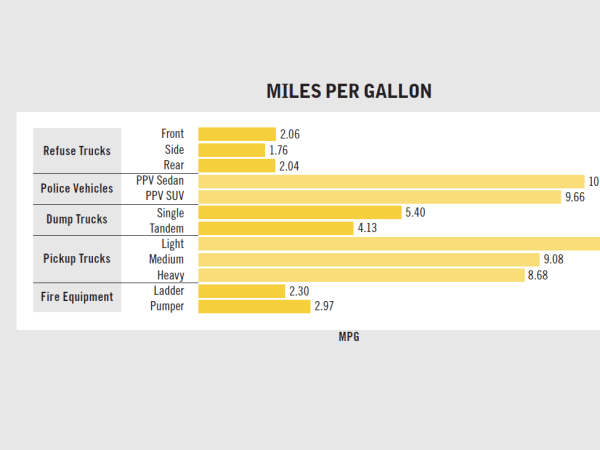
Refuse trucks and fire equipment have the lowest fuel economy.
Source: Utilimarc