

Five Steps to Developing a Balanced Scorecard
The state of Utah’s fleet and surplus property department recently implemented its own “balanced scorecard,” leading to significantly lower overhead costs and higher resale value.

The primary objective of creating and implementing a balanced
scorecard is to increase efficiency and productivity.However,a balanced scorecard approach offers many other benefits. This highly effective business strategy enables organizations to:
Identify or reassess “value drivers” who are key to achieving the mission of department and division.
Enable leadership to manage more effectively and respond to trends more quickly.
Focus attention on the few activities that will most affect results.
Improve departmental performance.
According to Robert Kaplan and David Norton, who wrote a 1992 Harvard Business Review article on “The Balanced Scorecard — Measures That Drive Performance,” the balanced scorecard measures an organization’s activities in terms of its vision and strategies. Basically, it gives managers a comprehensive view of business performance.
In Kaplan’s and Norton’s words, “If you can’t measure it, you can’t manage it,” and “When performance is measured, performance improves.”
With this strategic management system, managers focus on the important performance metrics that drive success. In other words, it balances a financial perspective with customer, internal process,
and learning and growth perspectives. The system consists of four vital processes:
Translating the vision into operational goals.
Communicating the vision and linking it to individual performance.
Business planning.
Providing feedback and learning and adjusting the strategy accordingly.
State of Utah Implements Balanced Scorecards
The state of Utah recently implemented its own balanced scorecard to
track performance metrics, increase individual accountability, and improve financial dimensions.
The balanced scorecard approach was an initiative of Utah Gov. John Huntsman, Jr., with guidance from the Utah Policy Partnership (UPP), a private-public partnership that explores and implements innovative ways of increasing productivity, efficiency, and direction within Utah government.
In December 2004, Huntsman asked the Department of Administrative Services to conduct a pilot program testing the balanced scorecard methodology. Today, all Utah state departments use their own balanced scorecards.
“I strongly believe these measures will make us more accountable for our actions and give us the ability to serve you — who in turn will have greater confidence in your public servants,” Huntsman said in his 2005 State-of-the-State address.
Margaret Chambers, Utah’s director of fleet and surplus property, helped implement a balanced scorecard for the state’s fleet and surplus department, which began using its balanced scorecard in July 2005. {+PAGEBREAK+}
“A balanced scorecard is a management tool that allows managers to lead through monitoring the performance of an organization on the few but vital set of activities and measures that drive enterprise success,” Chambers explained. “A scorecard is ‘balanced’ when it focuses not just on financial dimensions, but also other vital areas such as employees, customers, processes, and any other area crucial to the success of the organization.”
Before Creating Scorecards, Diagnose the Current Situation
Before creating a balanced scorecard, Chambers set out to diagnose the situation by assessing the current business environment, including individual metrics, the set of metrics, and organizational
entrenchment.
“This was a department initiative,” Chambers said. “We met with the UPP and defined the areas that would be tracked for the department.”
Tracked metrics include employee satisfaction, customer service, financial measures, and process excellence and efficiency.
Step 1. Set Overall Strategy and Primary Drivers
After the diagnostic phase was completed, Chambers began designing the
scorecard. During this step, she said it was vital to confirm the overall strategy and primary drivers.
“For instance, do you want to grow sales and improve margins? How about increase retention?” she said.“Make sure that each key metric is measurable, controllable, and focused.”
Individual Metrics. Individual metrics should be linked and controllable. Key performance indicators must have strong and clear linkage with the organization’s vision, strategy, and goals. They must be owned by those who will be accountable.
Finally, individual metrics must be measurable, with easily tracked available data.
Metric Sets.When utilizing a set of metrics, make sure they are balanced and focused. Key performance indicators must be balanced to include financial and nonfinancial metrics, as well as leading and lagging indicators. Performance should be assessed on the “vital few” key performance indicators, not the “trivial many” indicators. {+PAGEBREAK+}
When dealing with a set of metrics, Chambers stressed the importance of setting appropriate targets. Targets must be set appropriately so that they are a stretch, but achievable; they should be reviewed frequently.
Organizational Entrenchment. Another area of importance is organizational entrenchment, which should be cascaded up/down so that achievement of lowerlevel key performance indicators ensures the organization reaches its goals. It is also critical to achieve organizational buy-in, which requires that each organization accepts the metrics and targets.
“This was easy for us because we keep so many statistics,” Chambers said. “We reviewed our statute and mission statement and the statistics that we keep.”
Statistics kept by the state’s fleet department are available on the Utah’s fleet Web site, http://fleet.utah.gov. These reports include:
Rate matrix.
Surplus.
Fiscal year.
State vehicle.
Legislative updates.
Web real-time reports for:
Accidents and preventable accidents.
Fuel management and fuel throughout for state-owned vehicles.
Cost-per-mile exceptions.
Utilization by equipment.
Utilization by class/code and/or mileage.
Operators.
Take-home vehicle list.
Step 2. Filter to ‘Vital Few’ Indicators
It was time to filter down to the “vital few” key performance metrics, which can be a challenging step in the process for fleets that track a large amount of data.“The BSC suggests fewer than 15 key indicators, so this was the difficult part — to take all the data that we track and narrow it down to the indicators that drive our division,” Chambers said.
So, Chambers and team set out to filter down to their “vital few” metrics bybreaking out into groups. They first discussed key activities (drivers) that most affected their success. Then, they reviewed and proposed existing metrics.
Chambers’ team analyzed four key areas:
Brainstorming on additional ways to measure performance on key activities.
Screening metrics using “basic guidelines” and identifying “vital few.”
Discussing whether metrics are linked, controllable, balanced, and
Developing hypotheses on which metrics are “right.”
Step 3. Set Targets and Identify Secondary Drivers and Metrics
During the next phase of the project, Chambers set targets and identified secondary drivers and metrics. At this point in the process, Chambers emphasized the importance of making sure the scorecard’s guiding principles are on track.“It is important to set challenging targets,” Chambers said. “If you choose targets that you can reach without effort, you are missing the point of the process.”
Step 4. Draft Scorecards and Targets
Chambers made sure the appropriate people reviewed and signed off on all metrics and drivers, including UPP and the department director.Next, Chambers drafted the scorecards and targets. The scorecard design included several categories, including metric, target, frequency, beginning, previous, current, status, and trend. It is vital that scorecards are easy to read and understand.
“This step is to finalize the key performance indicators and capture the beginning measure,”Chambers said.“For example, under Process Excellence — Effectiveness, we used vehicle compliance percentage for PMs and recalls. Under Process Excellence — Efficiency, we used average full-lease vehicle cost per mile.” {+PAGEBREAK+}
Step 5. Implement and Execute a Balanced Scorecard
Finally, Chambers implemented and executed the balanced scorecards by:Communicating. Chambers communicated the plan during several manager meetings by explaining the balanced scorecard process and the department guidelines. “The managers were involved in developing the key performance indicators,” she said.
Training. Chambers made sure everyone understood how each metric was calculated and where to get the data.
Detailing roles and responsibilities. “We made assignments for who was responsible to submit the metric and when it is due,” Chambers said.
Outlining the management process. Chambers recommends using the scorecard in weekly and monthly meetings. Chambers’ scorecard is reviewed every month in a one-on-one meeting with the department director.
Determining the IT platform. According to Chambers, it is critical to determine how the statistics will be gathered and what software will be used for the scorecard. Chambers uses Web and Microsoft Access reports to collect the data, as well as Excel for the scorecard.
“Our scorecard is submitted to the department of administrative services every month,”Chambers said. “Several of our indicators roll up to the department scorecard, which is submitted to the governor.”
Fleet and Surplus Property Lowers Overhead Costs
Since implementing the balanced scorecard 18 months ago, fleet and surplus property’s overhead costs have dropped significantly, according to Chambers. She has also seen resale value increase. “We noticed that we were getting more for vehicle sales when we sold the vehicle at our location as opposed to sending the vehicles to our outsourced vendor,” she said. “We have changed our process to keep the vehicle on our lot longer to get the higher resale.”The balanced scorecard initiative has been well received in Chambers’ division.“ We have seen results from using it,” she said.
What’s Next for Utah’s Fleet and Surplus Property Division
Because the department’s balanced scorecard was implemented from the top down — from the governor and department of administrative services — fleet and surplus’ next step is to define scorecards for each section of its division, including fleet, fuel, surplus, and administration.“Each of the section scorecards will roll up to the division scorecard,”Chambers said. “We are working to get the employees to take ownership of the scorecard. Performance plans will show responsibilities that will roll to the section scorecard.”
Chambers is also developing a “visual scoreboard” for each section of the scorecard, which will help track the department’s progress over a 12-month period. The visual scoreboard assigns points as balls — fleet positives; strikes — fleet negatives; and outs — 3 outs equal zero points.
The scoreboard will also highlight vehicle compliance percentage, vehicle utilization, and cost per mile. Teams can score up to three “runs” per inning (or month).
More Operations

How Dakota County Built a More Structured Fleet Operation
Kevin Schlangen shares how Dakota County’s fleet moved from reactive repairs and limited oversight to a more structured approach built around planning, training, and long-term cost control.
Read More →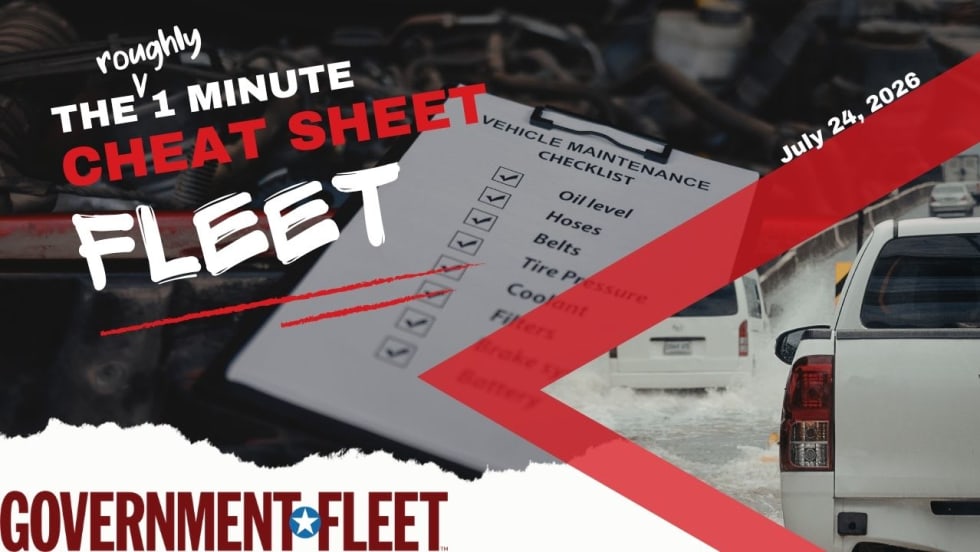
Is Your Fleet Ready Before the Storm Hits? | GovCast Cheat Sheet
Could better preparation before a storm and new vehicle technology help fleets recover faster while improving safety?
Read More →
New York City Orders Safety Technology for Municipal Fleet
New York City is expanding the use of pedestrian alerts and intelligent speed assistance across its non-emergency fleet. The executive order establishes new technology requirements for future vehicle purchases while accelerating retrofits on thousands of existing municipal trucks.
Read More →
The Network Behind Better Government Fleet Decisions
A discussion on why relationships across the government fleet community have played such an important role and what shapes the leadership response.
Read More →
Ford, BlackRock, Google and Carhartt Form Skilled Trades Workforce Alliance
The alliance plans to develop a stronger pipeline between training programs and available jobs while examining workforce efforts already underway across the country.
Read More →
The Network Behind Better Government Fleet Decisions
A discussion on why relationships across the government fleet community have played such an important role and what shapes the leadership response.
Read More →
What Makes Fleet Technicians Stay? | GovCast Cheat Sheet
The technician hiring and retention discussion is not new, but the way fleets respond to it continues to matter.
Read More →

On the Road with Government Fleet: Essential Podcasts for Professionals
Let's celebrate listening! Check out a GovCast podcast and discover the insights and strategies that can transform your fleet management approach.
Read More →
How Real-World Vehicle Use Guides Replacement And Budgets
Three public fleet leaders explain how they use real-world vehicle data and long-term planning to keep aging assets in service and make more informed replacement and budgeting decisions in a high-cost environment.
Read More →