




Photo Gallery: Benchmarking Statistics 2017
2017 Benchmarking Statistics: Fleet Sizes, Budgets & Outsourcing
Data from Government Fleet’s annual survey shows a continuing rise in the size of public fleets, and that fleets are working on catch-up replacements from the recession.
by Staff
September 1, 2017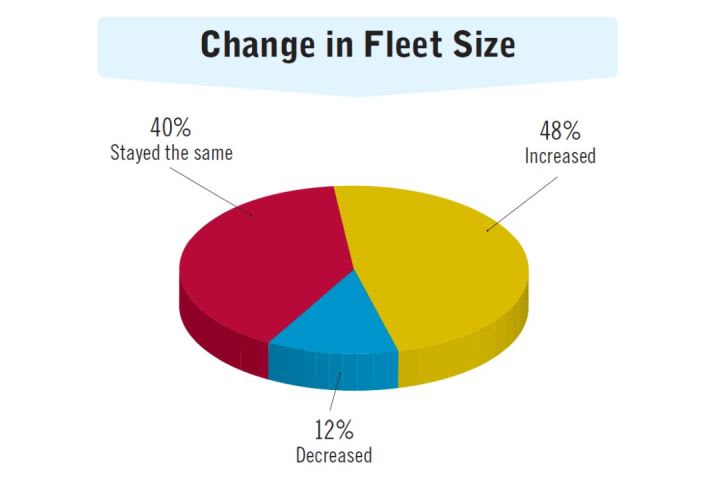
2 min to read
How is the public fleet industry doing? Government Fleet has compiled its annual benchmarking statistics using information from its own surveys as well as a fleet analytics company.
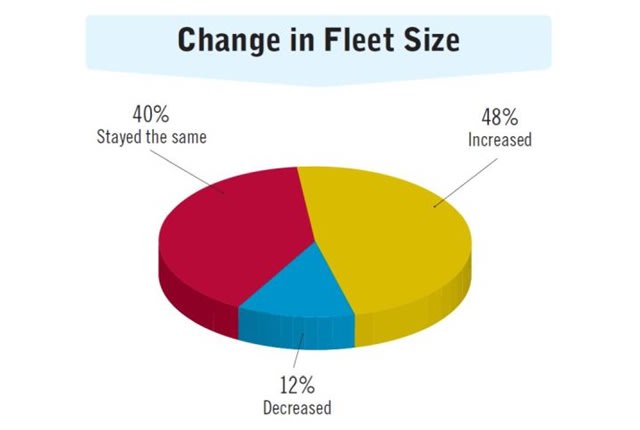
Data collected from the Government Fleet annual trends survey shows continued growth in fleet sizes, with nearly 50% of fleets reporting increases — a number that has risen since 2014. Fewer fleets reported rising operating budgets this year, and more reported no change. A slightly lower number of fleets reported replacement budget increases (47%) compared to the prior year (50%), and many of these said their increases are due to catch-up vehicle purchases.
New for this year is the average fleet inventory breakdown, showing that the largest vehicle categories respondents manage are passenger cars and SUVs, followed by trucks. Also new is average fleet inventory breakdown by fuel type, and telematics use.
Fleet professionals were additionally asked their top three concerns, with the results as follows:
45% Training needs
44% Aged fleet/Replacement budgeting
41% Advanced technology
35% Data management
32% Recruitment
30% Greening initiatives
29% Staff retirements
26% Staying competitive with the private sector
23% Increasing responsibilities of the fleet manager role
8% Other, including aging/outdated maintenance facilities, not enough staff, and increased cost of doing business
This year's benchmarking statistics are divided into two galleries: One presents the results from GF's industry survey.
The second gallery compiles data from Utilimarc, a fleet analytics and business intelligence company. This year's data shows that annual mileage driven (averaged from 2014 to 2016) has decreased for most vehicle categories, while vehicle age fluctuated, with some vehicle types reported to be older and others newer than the previous year’s data (averaged from 2013 to 2015).
Subscribe to Our Newsletter
More Operations
Is Keeping Older Fleet Vehicles Really Saving Money?
Is keeping vehicles longer saving money, and what happens when a diagnostic test points to the wrong fix?
Read More →
How Smart Fleet Strategy Can Help Local Government Agencies Do More with Less
Keeping a vehicle longer may ease this year’s budget, but what does it cost the next one? A closer look at fleet decisions can reveal opportunities to reduce spending while protecting essential services.
Read More →
Connect with Government Fleet on LinkedIn
From industry news and fleet management strategies to conversations with peers, Government Fleet's LinkedIn page offers public-sector fleet professionals another way to stay informed and connected.
Read More →
Town of Queen Creek Named Most Successful Fleet Award Winner of Inaugural RTA Fleet Success Awards
Five fleets were honored at RTA Connect 2026 in Chicago for excellence across resource efficiency, intentional culture, risk management, and stakeholder satisfaction.
Read More →
Sponsored•October 14, 2026
A buyer's guide to fleet management software in 2027
Buying fleet management software in 2027 means looking beyond features and price. As fleet operations, technology and expectations evolve, this guide explores what today’s fleet professionals should consider when choosing a system that can deliver value now and adapt to what comes next.
Read More →
Hazard Alerts, Fleet Car Sales Rise and a New Shuttle Concept
Fleet car sales doubled, but the bigger picture tells a different story in this week’s roundup.
Read More →
How St. Johns County Turned Fleet Data Into Better Replacement Decisions
St. Johns County, Florida, had fleet data, but turning it into reliable decision guidance was another matter. Instead of starting over with a new fleet management system, the county connected existing tools and built a scoring system that gives managers an objective look at fleet health.
Read More →
Fleet Forward Conference Introduces One-Day Passes for 2026
New one-day registration lets fleet professionals attend Tuesday, Wednesday, or Thursday, with passes available for $249.
Read More →
ENC Unveils its ZAVIR Medium-Duty Shuttle
Two variants of the concept shuttles were revealed: a low-floor configuration and a high-floor configuration.
Read More →
Could Your Next Fleet Technician Start as an Intern?
What if your next technician hasn’t worked in a fleet shop yet? What fleets are doing to free up time.
Read More →