Aging Fleets, Replacement Budgeting Top Concerns for Fleets
Almost 50% of respondents reported that their fleet size had increased with some agencies noting vehicles have been especially hard to procure, according to Government Fleet’s biennial industry survey.
November 5, 2023
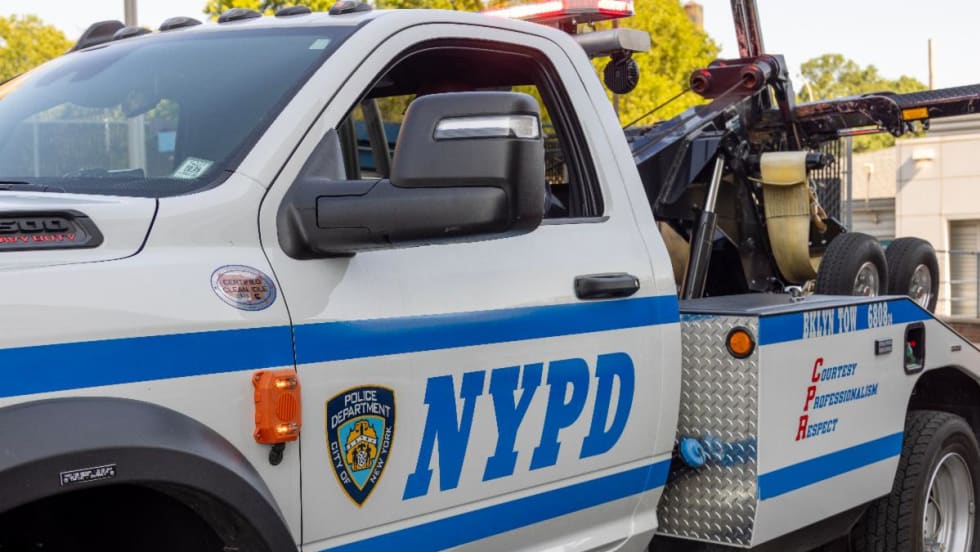
Photo: Government Fleet
3 min to read
Aging fleets and replacement budgeting were a top concern for fleets with recruitment following behind.
Photo: Government Fleet via Canva.com
While 46% of 2021 survey respondents listed green initiatives as their top concern, 2023 has shifted the focus to aging fleets and replacement budgeting with recruitment following behind. Still, going green continues to be a top priority for fleets with almost 40% listing this as a top concern for the following year.
Similar to the 2021 survey, gasoline vehicles are still the most common among government agencies, followed by diesel then E-85 flex-fuel vehicles. Similarly to the previous survey, electric vehicles make up a small portion of government fleets surveyed.
Ad Loading...
Meanwhile, just over 73% of respondents indicated that their replacement budget for the year is full funded. Most respondents (31.51%) reported that there was no change in the replacement budget of the current fiscal year versus the previous fiscal year.
Photo: Government Fleet
Annual Budgets and Top Concerns
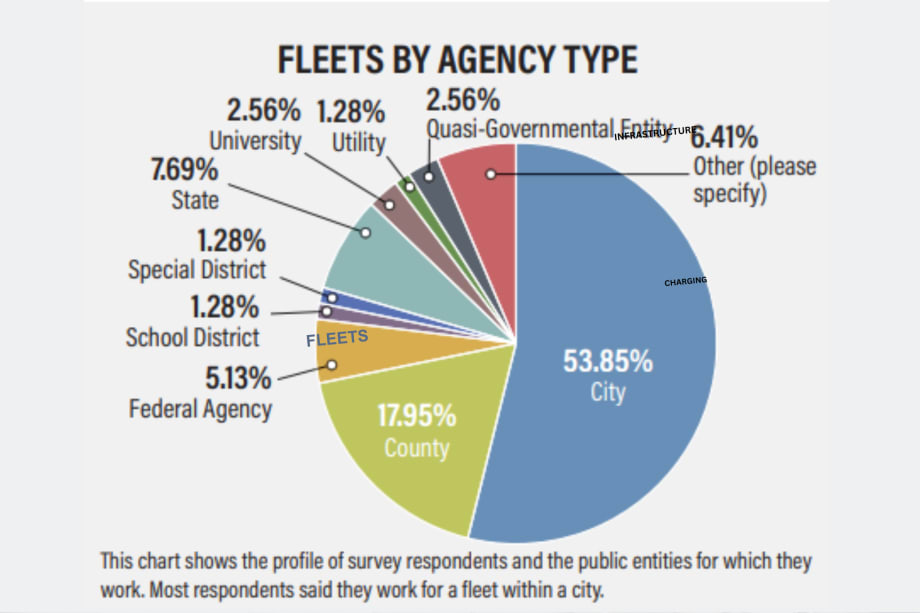
The majority of fleet respondents reported that they are an internal service fund with the majority also reporting that the agency has a replacement program/fund.
Most fleets also have an annual budget of $1 million or more. However, only 12% reported that their annual budget is $20 million or more. The annual change in budget of the current versus previous fiscal year saw a majority increase while roughly 31% of fleets reported no change in the replacement budget. Almost 74% of respondents reported that this year's replacement budget was fully funded.
In June and July, Government Fleet magazine solicited responses to a biennial survey from its readership, receiving 81 qualified responses from a diverse group of public fleet professionals. Information from this issue labeled “Source: Government Fleet Research” comes from this opt-in survey.
Respondents were also asked to pick their top three concerns, and aged fleets/replacement budgeting topped the list of biggest concerns for fleet managers. This was followed by recruitment, greening initiatives, training needs, and advanced technology.
Photo: Government Fleet
Fleet Sizes, Outsourcing, and Remarketing
In 2019 Government Fleet began sending the survey biennially. From 2021 to 2023, respondents noted a 12% increase in fleet size. From 2018 to 2019 there was a reported 13% increase in fleet size. However, since 2017 the reported fleet size has stayed roughly the same with respondents in 2017 reporting a 48% increase and a 47% increase in 2023.
Ad Loading...
Most fleets have kept outsourcing the same with just under 4% of respondents reporting an increase in outsourcing. Remarketing methods within the past year have also seen no change for most fleets with roughly 14% noting the fleet has done more online.
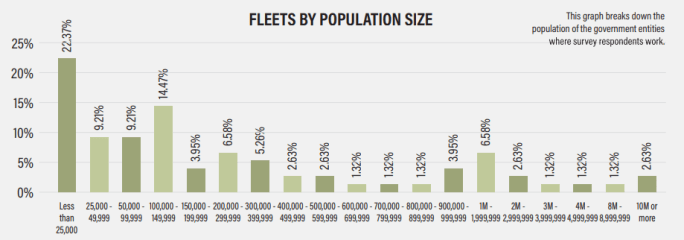
Most rolling stock fleet sizes are under 500 with less than 6% being 5,000 or above.
Fleet Makeup by Vehicle and Fuel Type
Passenger cars/SUVs made up the majority of fleets, according to respondents. Light-, medium-, and heavy-duty trucks made up 15%, 8%, and 8%, respectively. About 11% consisted of off-road equipment.
Gasoline still topped the fleet fuel makeup at 45% followed by diesel (32%) and flex fuel (13%). Hybrids and plug-in electric vehicles (including battery-electric vehicles and plug-in hybrids) made up less than 10%.
What Fleets Look Like and What They Do
The top three areas where fleets have customers include the parks department, public works, and streets maintenance.
Ad Loading...
Most fleets (75%) have between one and three maintenance facilities while 4% had 11 or more facilities. When it comes to the number of technicians allocated, 66% of respondents reported having 10 or less, with only 8% going over 100.
Just over 60% of respondents reported that less than 10 technician spots were filled with 29% reported having 11-100, and 10% having over 100.
Almost one-third of respondents said they have the Blue Seal of Excellence from the National Institute for Automotive Service Excellence (ASE). More than half of respondents reported that their agency was not ASE Blue Seal certified. About half the respondents reported that their agency requires technicians to have ASE/EVT certifications. A little over half of respondents said they do not provide incentive pay for those who have ASE/EVT certifications.
Check out more from the 2023 Industry Handbook Here.
Kevin Schlangen shares how Dakota County’s fleet moved from reactive repairs and limited oversight to a more structured approach built around planning, training, and long-term cost control.
New York City is expanding the use of pedestrian alerts and intelligent speed assistance across its non-emergency fleet. The executive order establishes new technology requirements for future vehicle purchases while accelerating retrofits on thousands of existing municipal trucks.
The alliance plans to develop a stronger pipeline between training programs and available jobs while examining workforce efforts already underway across the country.
Three public fleet leaders explain how they use real-world vehicle data and long-term planning to keep aging assets in service and make more informed replacement and budgeting decisions in a high-cost environment.