

2014 Public Fleet Overview
This overview provides information for nearly 200 public fleet survey respondents, including data about their customer departments, supervisors, outsourced services, and budget changes in the past year.
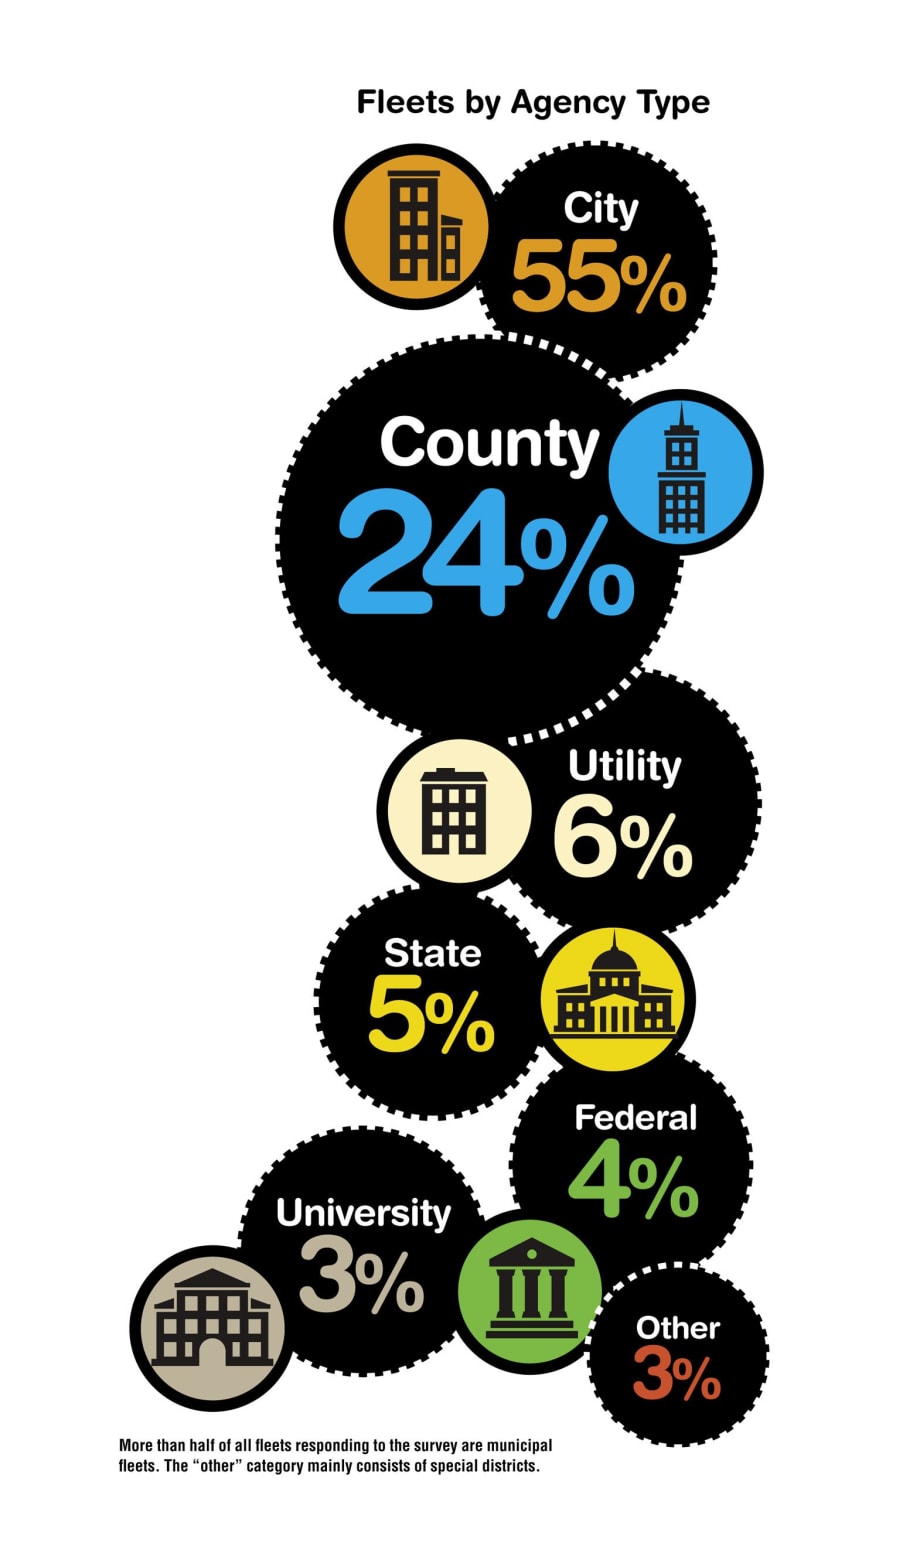
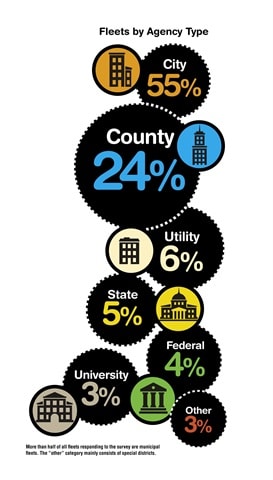
More than half of all fleets responding to the survey are municipal fleets. The "other" category mainly consists of special districts.
More than half of all fleets responding to the survey are municipal fleets. The "other" category mainly consists of special districts.
This section includes profile information from 181 fleets, including the types of agencies they work in, the population of the area the agency serves, and the customers the fleet departments serve. Additionally, it provides an overview of fleet budgets and how they have changed in the past year, commonly outsourced services, tool allowances, and current remarketing practices and changes.
Data collected from the survey suggest that fleet budgets continue to increase this year, with 49% of respondents reporting an increased fleet budget. This is a slight increase from last year, when 44% reported an increase and shows a slowly recovering economy — in 2012, only 17% of respondents reported any increase in fleet budget. The budget increases are low — mostly less than 5%.
For outsourced services, 7% of fleet respondents said they began outsourcing more work than they did the prior year, an and equal number of respondents said they were bringing previously contracted work in-house. Some of those who are bringing more work into the shop said they are doing so because they are getting full staffing levels or that furlough and hiring freezes have ended.
Data about remarketing practices suggest a continuing trend toward switching to online auctions.
Related:
More Operations
The Network Behind Better Government Fleet Decisions
A discussion on why relationships across the government fleet community have played such an important role and what shapes the leadership response.
Read More →
Ford, BlackRock, Google and Carhartt Form Skilled Trades Workforce Alliance
The alliance plans to develop a stronger pipeline between training programs and available jobs while examining workforce efforts already underway across the country.
Read More →
The Network Behind Better Government Fleet Decisions
A discussion on why relationships across the government fleet community have played such an important role and what shapes the leadership response.
Read More →
What Makes Fleet Technicians Stay? | GovCast Cheat Sheet
The technician hiring and retention discussion is not new, but the way fleets respond to it continues to matter.
Read More →

On the Road with Government Fleet: Essential Podcasts for Professionals
Let's celebrate listening! Check out a GovCast podcast and discover the insights and strategies that can transform your fleet management approach.
Read More →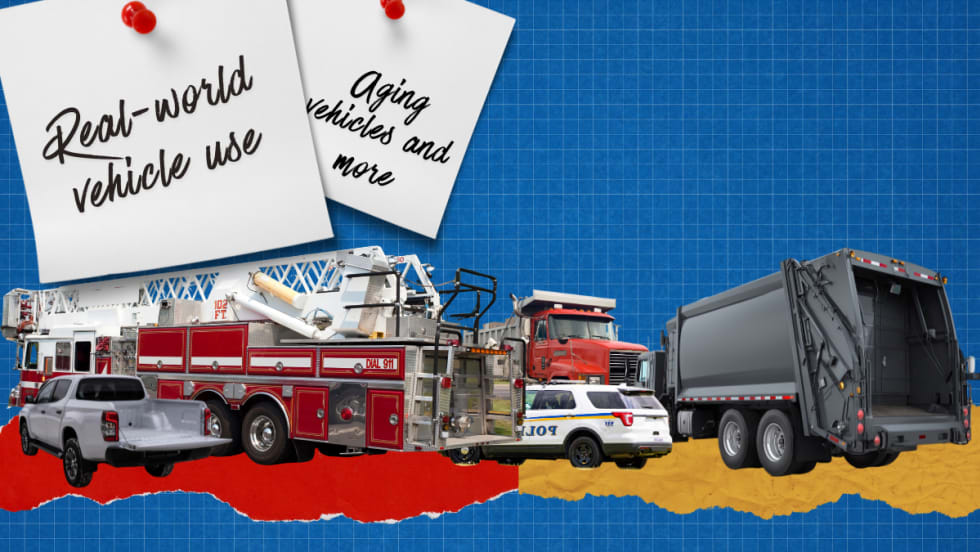
How Real-World Vehicle Use Guides Replacement And Budgets
Three public fleet leaders explain how they use real-world vehicle data and long-term planning to keep aging assets in service and make more informed replacement and budgeting decisions in a high-cost environment.
Read More →
When Fleet Data Has to Actually Mean Something | GovCast Cheat Sheet
Better fleet technology only works when the information behind it can actually support decisions.
Read More →
Why Public Fleet Success Depends on More Than the Vehicles | From the Show Floor with Tim Coxwell
Fleet decisions rarely stay inside the garage. From funding pressure to emissions planning, Tim Coxwell explains what it takes to keep a sheriff’s office fleet moving while planning for what comes next.
Read More →
How Government Fleets Helped Build America
As the United States celebrates its 250th anniversary, this look back explores how government fleets evolved from horse-drawn wagons to specialized vehicles that keep communities running today.
Read More →